
- Title
-
Zebrafish Model of Severe Combined Immunodeficiency (SCID) Due to JAK3 Mutation
- Authors
- Basheer, F., Lee, E., Liongue, C., Ward, A.C.
- Source
- Full text @ Biomolecules

ZFIN is incorporating published figure images and captions as part of an ongoing project. Figures from some publications have not yet been curated, or are not available for display because of copyright restrictions. |
|
ZFIN is incorporating published figure images and captions as part of an ongoing project. Figures from some publications have not yet been curated, or are not available for display because of copyright restrictions. |
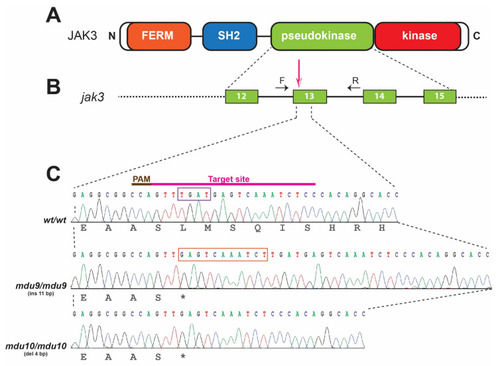
Generation of zebrafish carrying Jak3 mutations resembling those found in autosomal-recessive SCID. (A). Schematic representation of the JAK3 protein showing FERM (orange), SH2 (blue), pseudokinase (green) and kinase (red) domains. (B). Intron-exon structure of the zebrafish jak3 gene region encoding the pseudokinase domain, with the area targeted denoted with the pink arrow and the genotyping primers indicated by black arrows (F: forward, R: reverse). Exons are shown as numbered boxes and introns as solid lines. (C). Nucleotide sequence of zebrafish homozygous for wild-type (wt) and mutant (mdu9 and mdu10) alleles of jak3, with their protein translations displayed below in black text and the CRISPR/Cas9 target site shown above. The mdu9 allele represents an 11 bp insertion (orange box) and the mdu10 allele a 4 bp deletion (purple box), both resulting in frameshifts that introduce a stop codon at the equivalent location within the pseudokinase domain. |
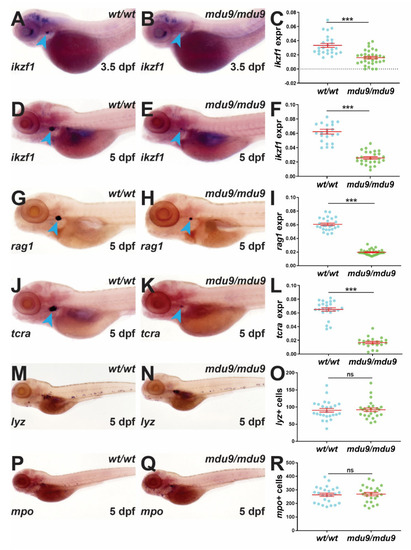
Analysis of embryonic zebrafish carrying Jak3 mutations. Analysis of immune cells in wild-type (wt/wt) and mutant (mdu9/mdu9) jak3 embryos using WISH with ikzf1 at 3.5 dpf (A,B) and 5 dpf (D,E), and rag1 (G,H), tcra (J,K), lyz (M,N) and mpo (P,Q) at 5 dpf. Representative embryos are shown with staining in the thymus indicated with blue arrowheads. Individual embryos were assessed for the area of expression for ikzf1 (C,F), rag1 (I) and tcra (L), expressed as a ratio to eye size averaged for individual embryos, or the number of lyz+ (O) and mpo+ (R) cells. Results for individuals are shown with the mean and SEM in red and level of statistical significance indicated (*** p < 0.001, ns not significant; n = 30). This result was confirmed in an additional experiment. EXPRESSION / LABELING:
PHENOTYPE:
|
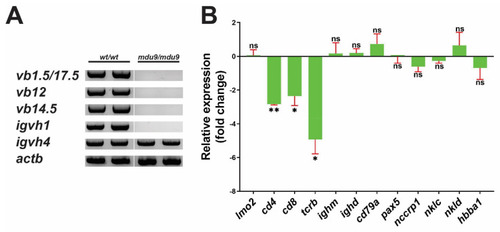
Effect of SCID-derived JAK3 mutations on zebrafish larval lymphopoiesis. Analysis of immune and blood cells in 28 dpf wild-type (wt/wt) and mutant (mdu9/mdu9) jak3 larvae using RT-PCR with primers specific for T cell receptor (TCR) β-chain (v(d)j-cβ vb1.5, vb12, vb14.5) and B cell Ig heavy chain (igvh1, igvh4) rearrangements along with actb as a control (n = 2) (A), noting that RT-negative controls yielded no products, or qRT2-PCR analysis with the indicated hematopoietic cell markers (B). Data is represented as relative fold-change compared to homozygous wild-type (wt/wt) larvae with mean and SEM shown in red and level of statistical significance of normalized Cq values (relative to control actb) indicated (** p < 0.01, * p < 0.05, ns not significant; n = 3). |
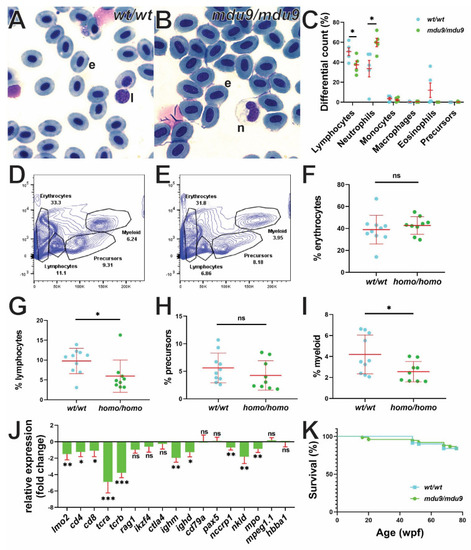
Effect of SCID-derived JAK3 mutations on zebrafish adult hematopoiesis. (A–C). Analysis of peripheral blood from adult wild-type (wt/wt) (A) and mutant (mdu9/mdu9) (B) jak3 fish using Giemsa staining (e: erythrocyte; l: lymphocyte; n: neutrophil), including differential counts of the indicated cell populations (C). (D–I) FACS analysis of adult kidney from wild-type (wt/wt) (D) and mutant (E) jak3 fish, along with quantitation of erythrocyte (F), lymphocyte (G), precursor (H) and myeloid (I) populations in wild-type (wt/wt) and mutant (homo/homo) individuals as indicated. (J) Analysis of hematopoietic cell lineages in adult kidney from wild-type and homozygous mutant fish using qRT2-PCR analysis with the indicated lineage cell markers. Data is represented as relative fold change compared to wild-type with mean and SEM shown in red and statistical significance of normalized Cq values (relative to control actb) indicated (*** p < 0.001, ** p < 0.01, * p < 0.05, ns not significant; n = 6). (K) Survival analysis of wild-type and mutant jak3 fish at each week post fertilization (wpf) displayed as a Kaplan–Meier plot (wt/wt, n = 70, mdu9/mdu9, n = 75). |

Analysis of lymphocytic leukemia in zebrafish harboring SCID-derived JAK3 mutations. Histology of organs from afflicted zebrafish showing leukemic infiltration into the brain (A,B), liver (C,D), kidney (E,F) and intestine (G,H) in representative jak3 mutant fish at 12 months post fertilization imaged at 10× (A,C,E,G) and 40× (B,D,F,H) magnification. Yellow arrowheads indicate leukemic cell infiltration. PHENOTYPE:
|