
Figure 2
- ID
- ZDB-IMAGE-221031-29
- Genes
- Publication
- Basheer et al., 2022 - Zebrafish Model of Severe Combined Immunodeficiency (SCID) Due to JAK3 Mutation
- All Figures
- Figures for Basheer et al., 2022
|
Figure 2
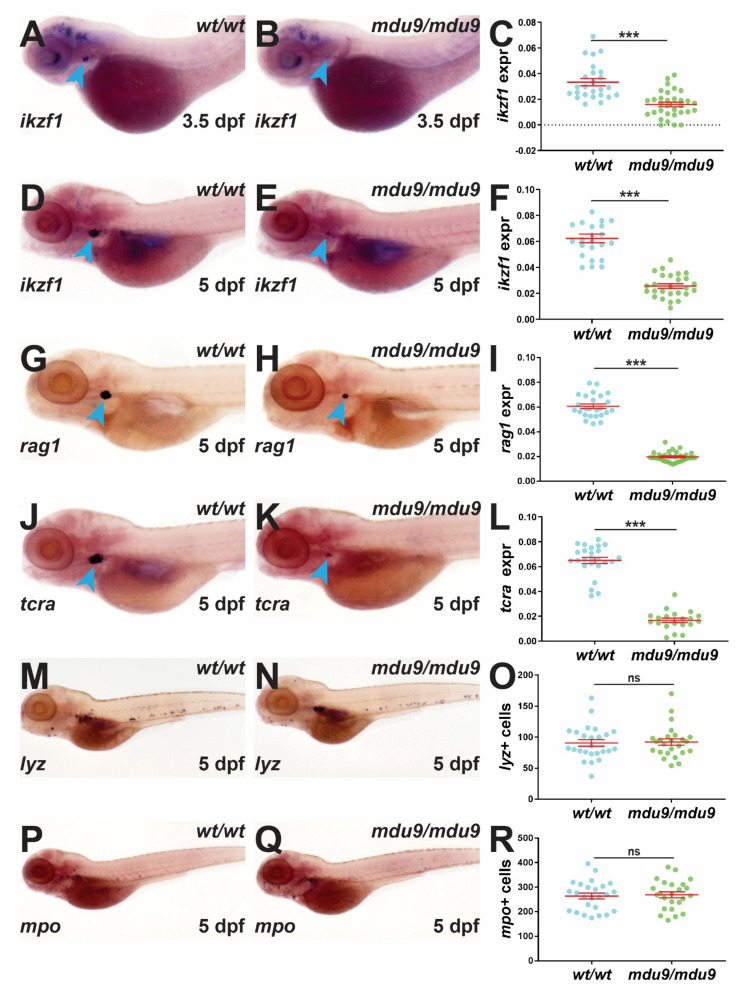
Analysis of embryonic zebrafish carrying Jak3 mutations. Analysis of immune cells in wild-type (wt/wt) and mutant (mdu9/mdu9) jak3 embryos using WISH with ikzf1 at 3.5 dpf (A,B) and 5 dpf (D,E), and rag1 (G,H), tcra (J,K), lyz (M,N) and mpo (P,Q) at 5 dpf. Representative embryos are shown with staining in the thymus indicated with blue arrowheads. Individual embryos were assessed for the area of expression for ikzf1 (C,F), rag1 (I) and tcra (L), expressed as a ratio to eye size averaged for individual embryos, or the number of lyz+ (O) and mpo+ (R) cells. Results for individuals are shown with the mean and SEM in red and level of statistical significance indicated (*** p < 0.001, ns not significant; n = 30). This result was confirmed in an additional experiment.