
Figure 4
|
Figure 4
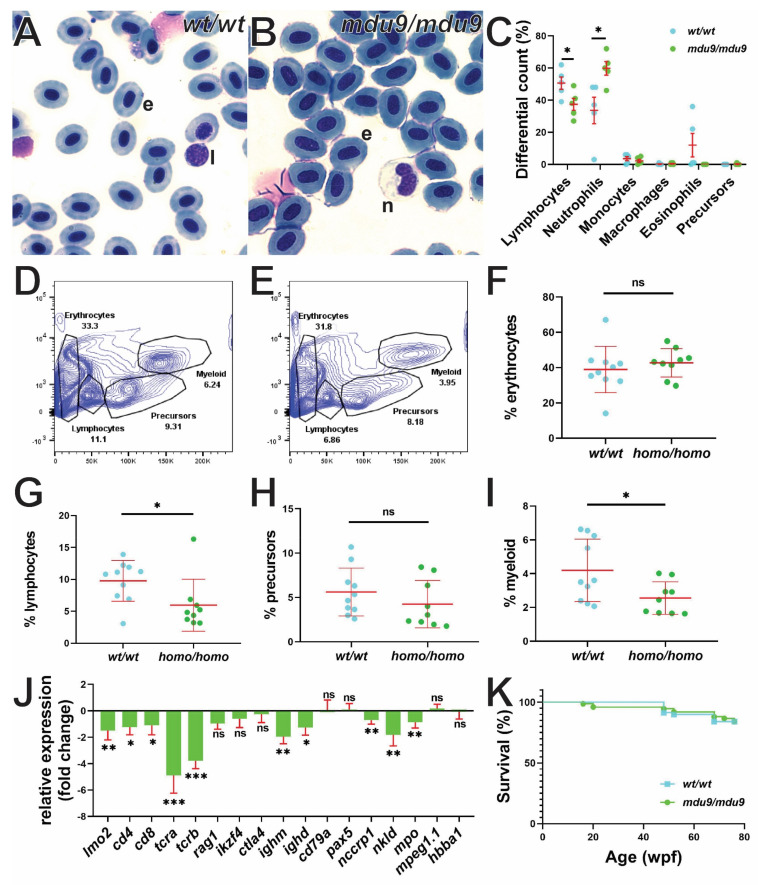
Effect of SCID-derived JAK3 mutations on zebrafish adult hematopoiesis. (A–C). Analysis of peripheral blood from adult wild-type (wt/wt) (A) and mutant (mdu9/mdu9) (B) jak3 fish using Giemsa staining (e: erythrocyte; l: lymphocyte; n: neutrophil), including differential counts of the indicated cell populations (C). (D–I) FACS analysis of adult kidney from wild-type (wt/wt) (D) and mutant (E) jak3 fish, along with quantitation of erythrocyte (F), lymphocyte (G), precursor (H) and myeloid (I) populations in wild-type (wt/wt) and mutant (homo/homo) individuals as indicated. (J) Analysis of hematopoietic cell lineages in adult kidney from wild-type and homozygous mutant fish using qRT2-PCR analysis with the indicated lineage cell markers. Data is represented as relative fold change compared to wild-type with mean and SEM shown in red and statistical significance of normalized Cq values (relative to control actb) indicated (*** p < 0.001, ** p < 0.01, * p < 0.05, ns not significant; n = 6). (K) Survival analysis of wild-type and mutant jak3 fish at each week post fertilization (wpf) displayed as a Kaplan–Meier plot (wt/wt, n = 70, mdu9/mdu9, n = 75).