
- Title
-
Ercc2/Xpd deficiency results in failure of digestive organ growth in zebrafish with elevated nucleolar stress
- Authors
- Ma, J., Shao, X., Geng, F., Liang, S., Yu, C., Zhang, R.
- Source
- Full text @ iScience
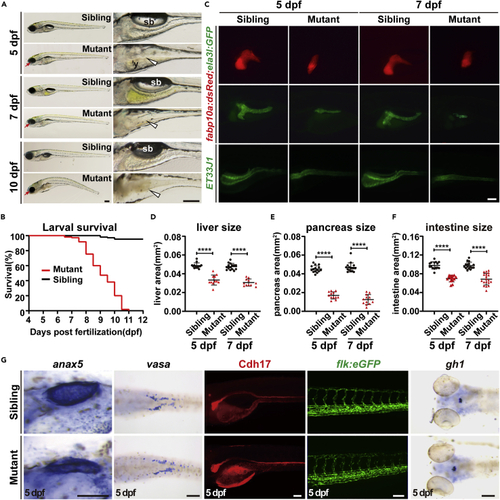
Ercc2/Xpd is crucial for zebrafish larvae development (A) Representative images of ercc2/xpd mutants and siblings at the indicated stages. Magnified images of digestive organs are shown on the right. Red arrows indicate microphthalmia in mutants. White arrowheads point to collapse the intestine in mutants. sb, swimming bladder; y, yolk. Scale bars, 200 μm. (B) Survival curves of ercc2/xpd mutants and siblings. n = 100 larvae each. (C) Fluorescence images of Tg(fabp10a:dsRed; ela3l:GFP) and ET33J1 fish showing endodermal organs of ercc2/xpd mutants and siblings at 5 and 7 dpf. Lateral view, anterior to the left. Scale bar, 100 μm. (D–F) Quantification of liver, pancreas, intestine tube area in ercc2/xpd mutants and siblings at 5 and 7 dpf. n ≥ 12. Data are presented as mean ± SD, Student’s t test, ∗∗∗∗, p < 0.0001. (G) Whole-mount in situ hybridization and fluorescence images showing mesoderm- and ectoderm-derived organs of ercc2/xpd mutants and siblings at 5 dpf. Scale bars, 100 μm. See also Figures S1 and S2. PHENOTYPE:
|
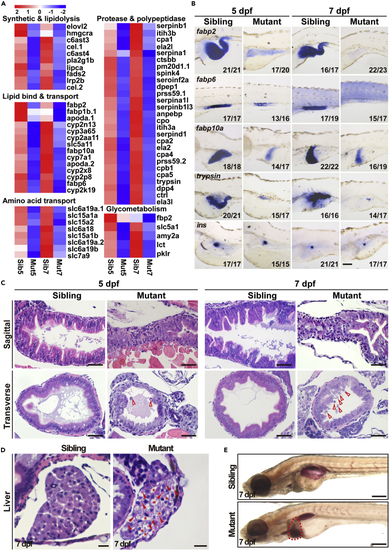
Digestive organ development is defective in ercc2/xpd mutants (A) Transcriptomic analysis revealed reduced expression of genes related to digestion and metabolism in ercc2/xpd mutants compared to siblings at 5 and 7 dpf. (B) Whole-mount in situ hybridization showing reduced expression of marker genes of intestine, liver, and exocrine, but not endocrine, pancreas, in ercc2/xpd mutants compared to siblings at 5 and 7 dpf. Lateral view, anterior to the left. Scale bar, 100 μm. See also Figure S3. (C) HE staining of sagittal and transverse sections of ercc2/xpd mutants and siblings at 5 and 7 dpf. The intestinal cavity in mutants is smaller or collapsed. Red arrowheads indicate detached cells and cellular debris. Scale bars, 25 μm. See also Figure S4A. (D) HE staining showing vacuolar liver (asterisks) and lipid droplets (arrowheads) in ercc2/xpd mutant liver sections at 7 dpf. Scale bars, 25 μm. (E) Whole-mount Oil Red O (ORO) staining showing fatty liver (dashed area) in ercc2/xpd mutants at 7 dpf. Lateral view, anterior to the left. Scale bar, 200 μm. See also Figure S4. |
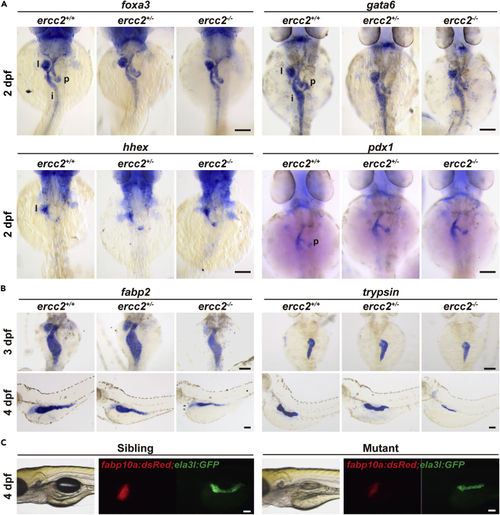
Digestive organ bud initiation is unaffected in ercc2/xpd mutants (A) Whole-mount in situ hybridization (WISH) of marker genes for digestive organ budding in ercc2/xpd mutants and siblings at 2 dpf. Dorsal view, anterior to the top. l, liver; p, pancreas; i, intestine. After individual imaging, embryos were subjected to individual genotyping. Scale bars, 100 μm. (B) WISH of marker genes for early development of digestive organs in ercc2/xpd mutants and siblings at 3 and 4 dpf. Upper: dorsal view, anterior to the top; lower: lateral view, anterior to the left. After individual imaging, embryos were subjected to individual genotyping. Scale bars, 100 μm. (C) Tg(fabp10a:dsRed; ela3l:GFP) revealed early development of digestive organs in ercc2/xpd mutants and siblings at 4 dpf. After individual imaging, embryos were subjected to individual genotyping. Scale bars, 100 μm. PHENOTYPE:
|

Ercc2/Xpd-deficient intestinal endothelial cells exhibit loss of cell polarity and impaired proliferation (A) Tg(Nkx2.2a:EGFP) marked intestinal endocrine cells in ercc2/xpd mutants and siblings at 5 dpf. Scale bars, 100 μm. (B) Alcian blue staining showed intestinal goblet cells (left) and quantification of their numbers (right) in ercc2/xpd mutants and siblings at 5 dpf. Scale bars, 100 μm. Data are presented as mean ± SD. Student’s t test, ∗∗∗∗, p < 0.0001. (C) EdU incorporation assay and immunostaining of the mitotic marker phospho-histone H3 revealed reduced the proliferation of intestinal endothelial cells (IECs) in ercc2/xpd mutants compared to siblings at 5 dpf. Scale bars, 100 μm. (D) Quantification of percentages of EdU-positive IECs or pH3-positive cells in different regions of the intestine. i.b., intestinal bulb; m.i., mid-intestine; p.i., posterior intestine. Data are presented as mean ± SD, Student’s t test, ∗∗∗∗, p < 0.0001, ∗∗∗, p < 0.001. See also Figure S4D. (E) The TUNEL assay showed no detectable apoptotic signals in IECs in ercc2/xpd mutants and siblings compared to the DNase-I-treated positive control at 7 dpf. Scale bars, 100 μm. See also Figure S5A. (F) Immunostaining of γ-H2A.X revealed no increased apoptosis or DNA instability in IECs in ercc2/xpd mutants compared to siblings at 7 dpf. Scale bars, 100 μm. |

Mitochondrial abnormalities, autophagy, and inflammation are highly induced (A) Transmission electron microscope images of intestinal endothelial cells (IECs) in ercc2/xpd mutants and siblings at 5 dpf. Arrows point to swollen and disarrayed mitochondria, red arrowheads point to autophagosome-like vesicles. m, mitochondrion. Scale bars, 1 μm. See also Figures S4B and S6A. (B) Immunostaining of the mitochondrial marker MT-CO1 in IECs in ercc2/xpd mutants and siblings at 5 dpf. Areas of dashed boxes are magnified. Scale bars, 20 μm. (C) Immunostaining of the autophagosomal marker LC3BII in IECs in ercc2/xpd mutants and siblings at 5 dpf. Areas of dashed boxes are magnified. Scale bars, 10 μm. (D) Transcriptomic analysis revealed increased expression of genes related to inflammation in ercc2/xpd mutants compared to siblings at 5 dpf. (E) qPCR verification of inflammation-related gene expression in ercc2/xpd mutants and siblings at 5 and 7 dpf. Data are presented as mean ± SD from three independent biological repeats. Student’s t test, ∗, p < 0.05, ∗∗, p < 0.01, NS, non-significant. See also Figure S6. |

Perturbed rRNA synthesis results in nucleolar stress (A) Transmission electron microscopy images of intestinal endothelial cell (IEC) nuclei in ercc2/xpd mutants and siblings at 5 dpf. Arrowheads point to enlarged nucleoli. Scale bars, 1 μm. (B–D) DAPI staining and immunostaining of the nucleolar markers fibrillarin and nucleolin in IECs in ercc2/xpd mutants and siblings at 5 dpf. Areas of dashed boxes are magnified. Arrowheads point to enlarged nucleoli, arrows indicate the translocation of nucleolar proteins to the nucleoplasm. Scale bars, 20 μm. See also Figure S7. (E) Schematic diagram showing stepwise processing of the pre-rRNA transcript. a-c corresponds to the rRNA intermediates. 5′ETS and ITS1 probes are indicated with green and red lines, respectively. ETS, external transcribed spacer; ITS, internal transcribed spacer. (F) Northern blot using 5′ETS and ITS1 probes to detect precursor forms of rRNA in ercc2/xpd mutants and siblings at 5 dpf. Methylene blue staining was used as a loading control. (G and H) Representative E-Bioanalyzer analysis and measurement of the 28S/18S rRNA ratio in ercc2/xpd mutants (M) and siblings (S) at 5 and 7 dpf. Data are presented as mean ± SD, Student’s t test, NS, non-significant. |

Ercc2/Xpd-deficient phenotypes are independent of an activated p53 response (A) qPCR analysis of expressions of genes associated with tp53 activation in ercc2/xpd mutants and siblings at 5 and 7 dpf. Data are presented as mean ± SD from three independent biological repeats. Student’s t test, ∗, p < 0.05, ∗∗, p < 0.01, NS, non-significant. (B) Whole-mount in situ hybridization showed a large up-regulation of tp53 in digestive organs (white arrowheads), retina (white arrow) and arches (black arrowheads) of ercc2/xpd mutants at 5 dpf. Scale bars, 100 μm. (C) Whole-mount in situ hybridization revealed that tp53 mutation did not affect ercc2/xpd mutant phenotypes in digestive organs or hematopoiesis. Scale bars, 100 μm. (D) Schematic diagram showing the possible mechanism of how Ercc2/Xpd deficiency leads to failure of digestive organ growth. See also Figure S9. |