
Fig. 7
- ID
- ZDB-IMAGE-220908-29
- Genes
- Publication
- Ma et al., 2022 - Ercc2/Xpd deficiency results in failure of digestive organ growth in zebrafish with elevated nucleolar stress
- All Figures
- Figures for Ma et al., 2022
|
Fig. 7
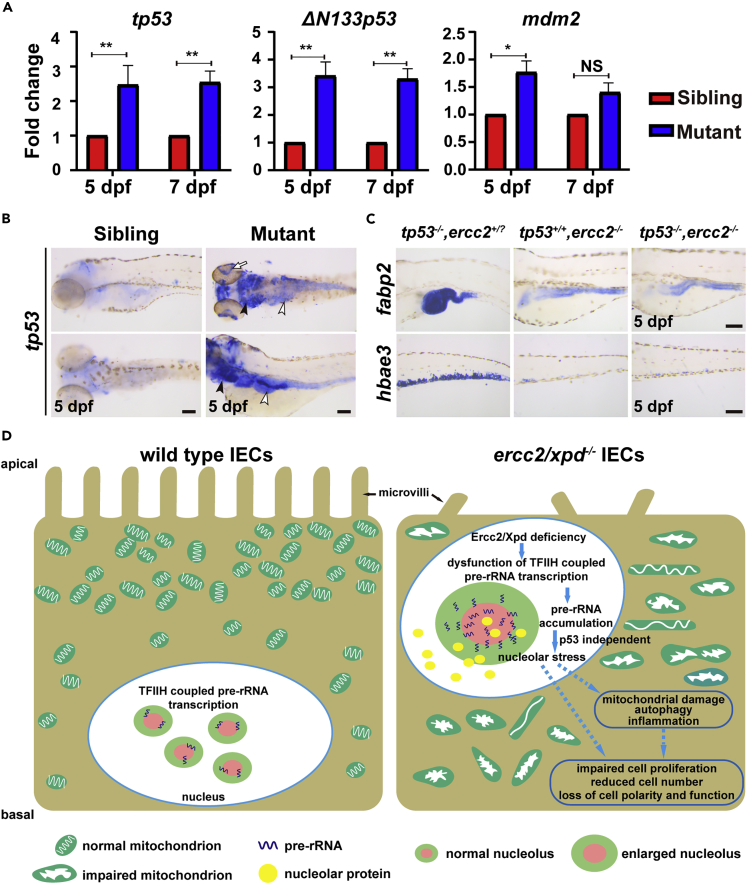
Ercc2/Xpd-deficient phenotypes are independent of an activated p53 response
(A) qPCR analysis of expressions of genes associated with tp53 activation in ercc2/xpd mutants and siblings at 5 and 7 dpf. Data are presented as mean ± SD from three independent biological repeats. Student’s t test, ∗, p < 0.05, ∗∗, p < 0.01, NS, non-significant.
(B) Whole-mount in situ hybridization showed a large up-regulation of tp53 in digestive organs (white arrowheads), retina (white arrow) and arches (black arrowheads) of ercc2/xpd mutants at 5 dpf. Scale bars, 100 μm.
(C) Whole-mount in situ hybridization revealed that tp53 mutation did not affect ercc2/xpd mutant phenotypes in digestive organs or hematopoiesis. Scale bars, 100 μm.
(D) Schematic diagram showing the possible mechanism of how Ercc2/Xpd deficiency leads to failure of digestive organ growth. See also Figure S9.