
- Title
-
Erianin Controls Collagen-Mediated Retinal Angiogenesis via the RhoA/ROCK1 Signaling Pathway Induced by the alpha2/beta1 Integrin-Collagen Interaction
- Authors
- Li, X., Liu, X., Xing, Y., Zeng, L., Liu, X., Shen, H., Ma, J.
- Source
- Full text @ Invest. Ophthalmol. Vis. Sci.
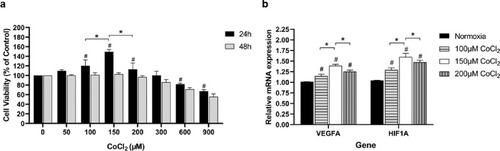
Determination of CoCl2 concentration for the cell hypoxia model. (A) Cell proliferation was tested by CCK-8 assay. The 0nM CoCl2 treated group was chosen as control. (B) The mRNA expression of VEGFA and HIF1A in HRVECs was tested after 24 hours of CoCl2 exposure. Values are expressed as the mean ± SD. VEGFA, vascular endothelial growth factor A; HIF1A, hypoxia-inducible factor 1-alpha. Normoxia group was set as the control at 100%. * Significant difference among CoCl2 with various concentrations (100 µM, 150 µM, and 200 µM; paired t-test, P < 0.05). # Significant difference of CoCl2 groups (100 µM, 150 µM, and 200 µM) compared with the control normoxia group (paired t-test, P values < 0.05). |
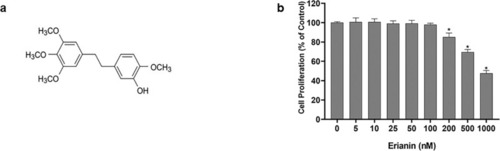
The effect of erianin on the proliferation of HRVECs. (A) Chemical structure of erianin. (B) The effect of erianin on the proliferation of HRVECs. Data are presented as percentages relative to the untreated control (0 nM erianin; % of control). * Significant difference in erianin at various concentrations (200 nM, 500 nM, and 1000 nM) compared with the control group (paired t-test, P values < 0.05). |
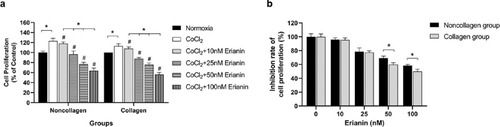
Effect of erianin on the proliferation of HRVECs induced by CoCl2 for 24 h ours . Cell proliferation was determined by CCK-8 assay. (A) HRVECs were treated with erianin at various concentrations (0–100 nM). Comparison of the inhibition rate of cell proliferation among collagen groups and among noncollagen groups. The normoxia group without erianin treatment was set as the control at 100%. (B) The inhibition rate of cell proliferation was compared between hypoxic HRVECs cultured under collagen and noncollagen conditions. Hypoxic cells without erianin treatment were set as the control at 100%. * Significant difference between samples (paired t-test, P values < 0.05); # Significant difference compared with CoCl2-incubated cells without erianin treatment (paired t-test, P values < 0.05). † Significant difference between collagen- and noncollagen-culture groups (independent sample t-test, P values < 0.05). |
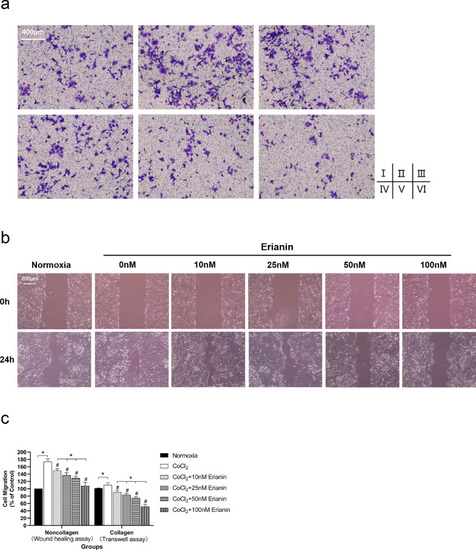
Effect of erianin on HRVEC migration. (A) Collagen-cultured hypoxic HRVEC migration was evaluated by Transwell assay (100 ×). (Ⅰ) Cells without CoCl2 and erianin exposure; (Ⅱ) cells with CoCl2 and without erianin exposure; hypoxic cells exposed to erianin at various concentrations of 10 nM (Ⅲ), 25 nM (Ⅳ), 50 nM (Ⅴ), and 100 nM (Ⅵ). (B) Cell migration of noncollagen-cultured HRVECs evaluated by wound healing assays (100 ×). (C) Comparison of the inhibition rate of cell migration among collagen groups and among noncollagen groups. The normoxia group was set as the control at 100%. * Significant difference between samples (paired t-test, P values < 0.05); # Significant difference compared with CoCl2-incubated cells without erianin treatment (paired t-test, P values < 0.05). |
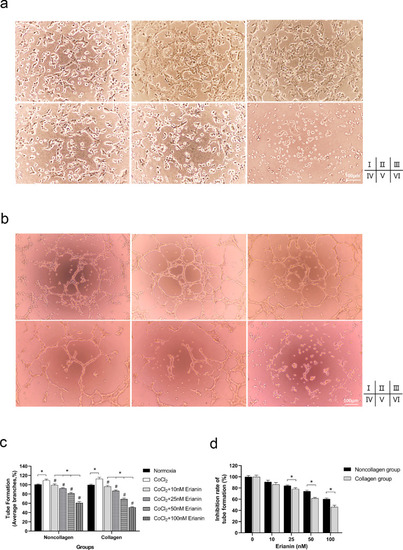
Effect of erianin on tube formation of HRVECs. (A) Tube formation of collagen-cultured HRVECs exposed to DMEM (Ⅰ), CoCl2 (Ⅱ), or erianin at various concentrations (10 nM [Ⅲ], 25 nM [Ⅳ], 50 nM [Ⅴ], and 100 nM [Ⅵ] [100 ×). (B) Tube formation of noncollagen-cultured HRVECs exposed to DMEM (Ⅰ), CoCl2 (Ⅱ), or erianin at various concentrations (10 nM [Ⅲ], 25 nM [Ⅳ], 50 nM [Ⅴ], 100 nM [Ⅵ] 100 ×). (C) Comparison of cell tube formation among collagen groups and among noncollagen groups. The normoxia group was set as the control at 100%. (D) The inhibition rate of tube formation was compared between hypoxic HRVECs cultured under collagen and noncollagen conditions. Hypoxic cells without erianin treatment were set as the controls at 100%. * Significant difference between samples (paired t-test, P values < 0.05); # Significant difference compared with CoCl2-incubated cells without erianin treatment (paired t-test, P values < 0.05); † Significant difference between collagen- and noncollagen-culture group (independent sample t-test, P values < 0.05). |
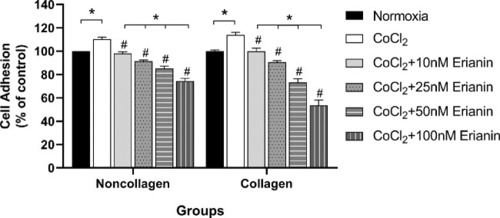
Effect of erianin on HRVEC adhesion. Comparison of cell adhesion ability in each collagen- and noncollagen-culture groups. The normoxia group was set as the control at 100%. * Significant difference between samples (paired t-test, P values < 0.05); # Significant difference compared with CoCl2-incubated cells without erianin treatment (paired t-test, P values < 0.05). |
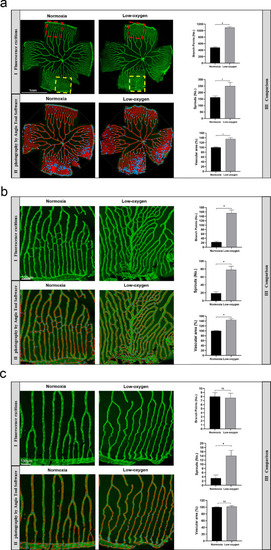
Comparison of low oxygen-induced retinal neovascularization in adult zebrafish. (A) Confocal microscopic observation of total retinal vessels in adult zebrafish. (B) Confocal microscopic observation of high vascularity areas of the retina (within the 350 µm square yellow area in panels A–I) in adult zebrafish. (C) Confocal microscopic observation of low vascularity areas of the retina (within the 350 µm square red area in panels A–I) in adult zebrafish. (I) Fluorescence excitation; (II) Photography by Angio Tool Software. The outline of the vasculature is shown in yellow, the skeleton representation of vasculature in red and branching points are blue; (III) comparison of vessel branch points, sprouts, and vascular area. * Significant difference compared with the normoxia group (paired t-test, P values < 0.05). PHENOTYPE:
|

Effect of erianin on low oxygen-induced retinal neovascularization in adult zebrafish. (A) Confocal microscopic observation of total retinal vessels in adult zebrafish treated with erianin (200 nM and 1000 nM). (B) Confocal microscopic observation of high vascularity areas of the retina (within the 350 µm square yellow area in panels A–-I) in adult zebrafish treated with erianin (200 nM and 1000 nM). (C) Confocal microscopic observation of low vascularity areas of the retina (within the 350 µm square red area in panels A–I) in adult zebrafish treated with erianin (200 nM and 1000 nM). (I) Fluorescence excitation; (II) Photography by Angio Tool Software. The outline of the vasculature is shown in yellow, the skeleton representation of vasculature in red and branching points are blue; (III) Comparison of vessel branch points, sprouts, and vascular area. * Significant difference compared with normoxia group (paired t-test, P values < 0.05). PHENOTYPE:
|
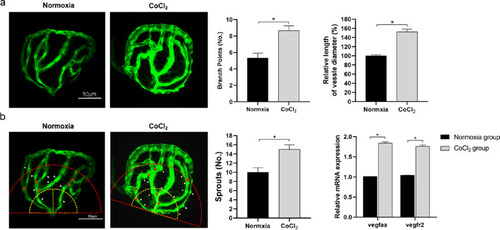
Comparison of CoCl2-induced retinal neovascularization in zebrafish embryos. (A) With fluorescence excitation, excessive retinal vascularization was shown in 5 mM CoCl2-treated embryos compared with the untreated control at the same developmental stage. (B) The method of counting branch points (red asterisks), vessel sprouts (white arrowheads) within a red semicircle with a radius of 100 µm, and measuring the mean diameter of the retinal vessels proximal to the optic disc (within the yellow semicircle with a radius of 50 µm). Comparison of branch points, vessel diameter and sprouts. mRNA expression of vegfaa and vegfr2 in the retinas of zebrafish embryos. * Significant difference compared with the normoxia group (independent sample t-test, P values < 0.05). |

Effect of erianin on CoCl2-induced retinal neovascularization in zebrafish embryos. (A) Confocal microscopic observation of retinal vessels in zebrafish embryos treated with erianin at various concentrations (0, 200, and 1000 nM). The panels show the method for counting vessel branch points (red asterisks), sprouts (white arrowheads) within the red semicircle with a radius of 100 µm, and measuring the mean diameter of the retinal vessels proximal to the optic disc (within the yellow semicircle with a radius of 50 µm). (B) Comparison of branch points, vessel diameter, and sprouts. * Significant difference among samples after multiple comparisons (SNK-q test, P values < 0.05). PHENOTYPE:
|
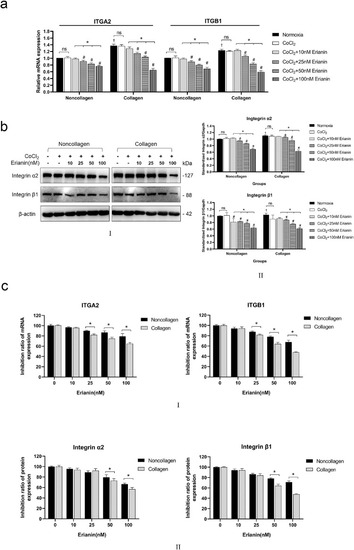
Effects of erianin on α2 and β1 integrins in vitro. (A) The mRNA levels of ITGA2 and ITGB1 in HRVECs exposed to normoxia, CoCl2, or erianin at various concentrations. (B) (B–I) Protein levels of α2 and β1 integrins in HRVECs exposed to normoxia, CoCl2, or erianin at various concentrations. (B–II) Quantitative analysis of α2 and β1 integrins; the results are presented as percentages of the normoxia group. (C) (C–I) The inhibition ratios of ITGA2 and ITGB1 were compared between hypoxic HRVECs cultured under collagen and noncollagen conditions and treated with erianin at various concentrations. (C–II) The inhibition ratios of α2 and β1 integrin proteins were compared between hypoxic HRVECs cultured under collagen and noncollagen conditions and treated with erianin at various concentrations. Hypoxic cells without erianin treatment were set as controls at 100%. * Significant difference between samples (paired t-test, P values < 0.05); # Comparison with the noncollagen group of CoCl2-incubated cells without erianin treatment (paired t-test, P values < 0.05); † Comparison with the noncollagen group of normoxia cells without erianin treatment (independent sample t-test, P values < 0.05); $ Significant difference between collagen and noncollagen groups (independent sample t-test, P values < 0.05; ITGA2: integrin subunit alpha 2 [human]; ITGB1: integrin subunit beta 1 [human]). |

Effects of erianin on α2 and β1 integrins in vivo. (A) mRNA levels of itga2 and itgb1 in adult and embryonic zebrafish retinas exposed to normoxia, hypoxia, or erianin at various concentrations. (B) (B–I) Protein levels of α2 and β1 integrins in the retinas of adult and embryonic zebrafish under normoxia, hypoxia, or erianin at various concentrations. (B–II) Quantitative analysis of α2 and β1 integrins; the results are presented as percentages of the normoxia group. (C) (C–I) The inhibition ratios of itga2 and itgb1 were compared between low-oxygen induced adult zebrafish and CoCl2-induced zebrafish embryos. (C–II) The inhibition ratios of α2 and β1 integrin proteins were compared between hypoxia-induced adult zebrafish and CoCl2-induced zebrafish embryos and treated with erianin at various concentrations. Low-oxygen induced adult zebrafish and CoCl2-induced zebrafish embryos without erianin treatment were set as controls at 100%. * Significant difference (P values < 0.05) between samples in the adult zebrafish (paired t-test) in A, in the zebrafish embryos (independent sample t-test) in B, and between adult zebrafish and zebrafish embryos (independent sample t-test) in C); # Comparison with adult zebrafish induced by low oxygen without erianin treatment (paired t-test, P values < 0.05) or with zebrafish embryos induced by CoCl2 without erianin treatment (independent sample t-test, P values < 0.05); † Comparison with normoxia zebrafish embryos without erianin treatment (independent sample t-test, P values < 0.05); (itga2: integrin subunit alpha 2 [zebrafish]; itgb1: integrin subunit beta 1 [zebrafish]). |
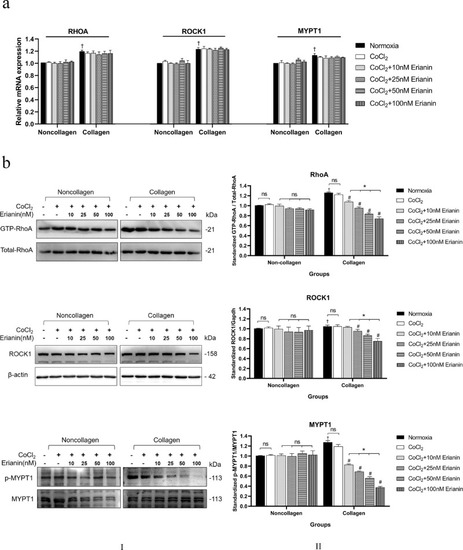
Effects of erianin on the RhoA/ROCK1 pathway in vitro. (A) The mRNA levels of RHOA, ROCK1, and MYPT1 in HRVECs exposed to normoxia, CoCl2, or erianin at various concentrations. (B) (B–I) Protein levels of GTP-RhoA, ROCK1, and p-MYPT1 in HRVECs exposed to normoxia, CoCl2, or erianin at various concentrations. (B–II) Quantitative analysis of GTP-RhoA, ROCK1, and p-MYPT1; the results are presented as percentages of the normoxia group. * Significant difference between samples (paired t-test, P values < 0.05); # Comparison with the collagen group of CoCl2-incubated cells without erianin treatment (paired t-test, P values < 0.05); † Comparison with noncollagen group of normoxia cells without erianin treatment (independent sample t-test, P values < 0.05). |

Effects of erianin on the RhoA/ROCK1 pathway in vivo. (A) The mRNA levels of rhoa, rock1I, and mypt1 in adult and embryonic zebrafish retinas exposed to normoxia, hypoxia, or erianin at various concentrations. B (B–I) Protein expression of GTP-RhoA, ROCK1, and p-MYPT1 in adult and embryonic zebrafish retinas under normoxia, hypoxia, or erianin at various concentrations. (B–II) Quantitative analysis of GTP-RhoA, ROCK1, and p-MYPT1 in adult and embryonic zebrafish retinas. The results are presented as percentages of the normoxia group. * Significant difference between samples in the adult zebrafish (paired t-test, P values < 0.05) and in the zebrafish embryos (independent sample t-test, P values < 0.05); # Comparison with adult zebrafish induced by low-oxygen without erianin treatment (paired t-test, P values < 0.05) or with zebrafish embryos induced by CoCl2 without erianin treatment (independent sample t-test, P values < 0.05); † Comparison with normoxic zebrafish embryos without erianin treatment (independent sample t-test, P values < 0.05). |