
|
Fig. 13
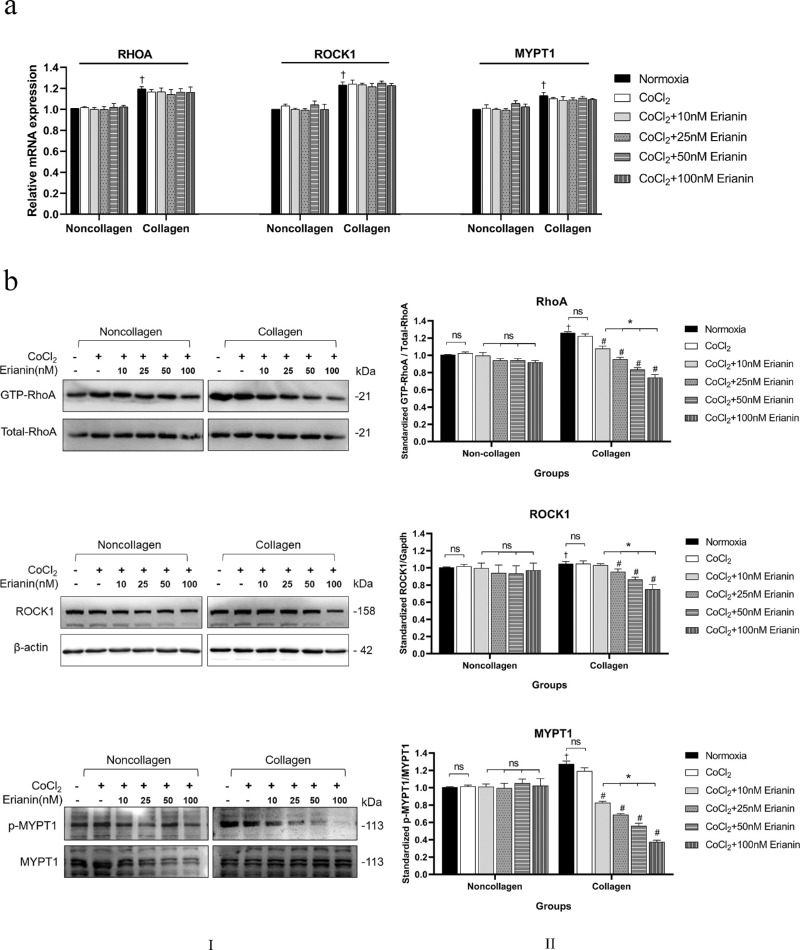
Effects of erianin on the RhoA/ROCK1 pathway in vitro. (A) The mRNA levels of RHOA, ROCK1, and MYPT1 in HRVECs exposed to normoxia, CoCl2, or erianin at various concentrations. (B) (B–I) Protein levels of GTP-RhoA, ROCK1, and p-MYPT1 in HRVECs exposed to normoxia, CoCl2, or erianin at various concentrations. (B–II) Quantitative analysis of GTP-RhoA, ROCK1, and p-MYPT1; the results are presented as percentages of the normoxia group. * Significant difference between samples (paired t-test, P values < 0.05); # Comparison with the collagen group of CoCl2-incubated cells without erianin treatment (paired t-test, P values < 0.05); † Comparison with noncollagen group of normoxia cells without erianin treatment (independent sample t-test, P values < 0.05).