
|
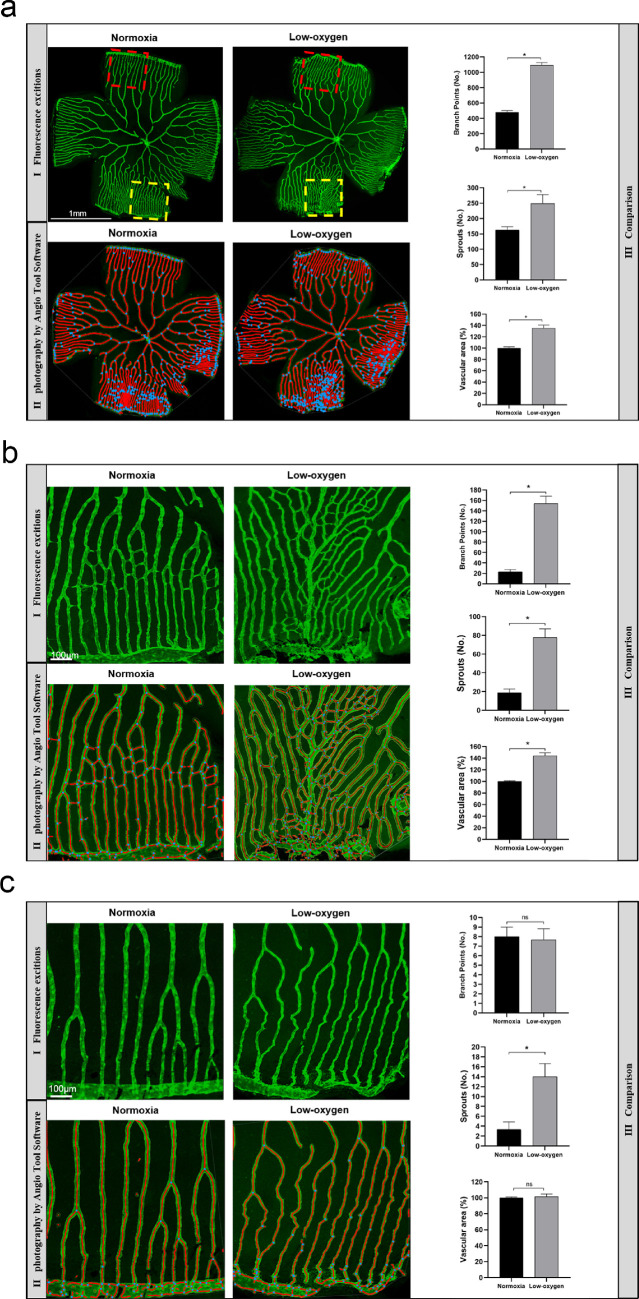
Fig. 7
Comparison of low oxygen-induced retinal neovascularization in adult zebrafish. (A) Confocal microscopic observation of total retinal vessels in adult zebrafish. (B) Confocal microscopic observation of high vascularity areas of the retina (within the 350 µm square yellow area in panels A–I) in adult zebrafish. (C) Confocal microscopic observation of low vascularity areas of the retina (within the 350 µm square red area in panels A–I) in adult zebrafish. (I) Fluorescence excitation; (II) Photography by Angio Tool Software. The outline of the vasculature is shown in yellow, the skeleton representation of vasculature in red and branching points are blue; (III) comparison of vessel branch points, sprouts, and vascular area. * Significant difference compared with the normoxia group (paired t-test, P values < 0.05).