
|
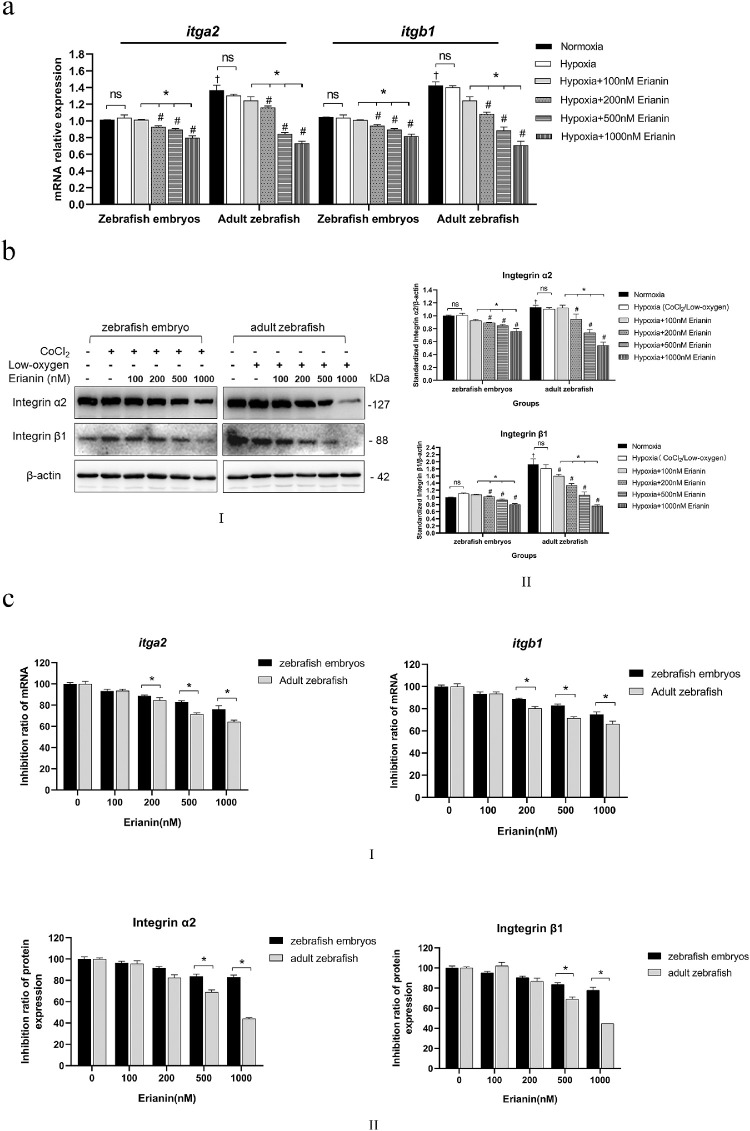
Fig. 12
Effects of erianin on α2 and β1 integrins in vivo. (A) mRNA levels of itga2 and itgb1 in adult and embryonic zebrafish retinas exposed to normoxia, hypoxia, or erianin at various concentrations. (B) (B–I) Protein levels of α2 and β1 integrins in the retinas of adult and embryonic zebrafish under normoxia, hypoxia, or erianin at various concentrations. (B–II) Quantitative analysis of α2 and β1 integrins; the results are presented as percentages of the normoxia group. (C) (C–I) The inhibition ratios of itga2 and itgb1 were compared between low-oxygen induced adult zebrafish and CoCl2-induced zebrafish embryos. (C–II) The inhibition ratios of α2 and β1 integrin proteins were compared between hypoxia-induced adult zebrafish and CoCl2-induced zebrafish embryos and treated with erianin at various concentrations. Low-oxygen induced adult zebrafish and CoCl2-induced zebrafish embryos without erianin treatment were set as controls at 100%. * Significant difference (P values < 0.05) between samples in the adult zebrafish (paired t-test) in A, in the zebrafish embryos (independent sample t-test) in B, and between adult zebrafish and zebrafish embryos (independent sample t-test) in C); # Comparison with adult zebrafish induced by low oxygen without erianin treatment (paired t-test, P values < 0.05) or with zebrafish embryos induced by CoCl2 without erianin treatment (independent sample t-test, P values < 0.05); † Comparison with normoxia zebrafish embryos without erianin treatment (independent sample t-test, P values < 0.05); (itga2: integrin subunit alpha 2 [zebrafish]; itgb1: integrin subunit beta 1 [zebrafish]).