
|
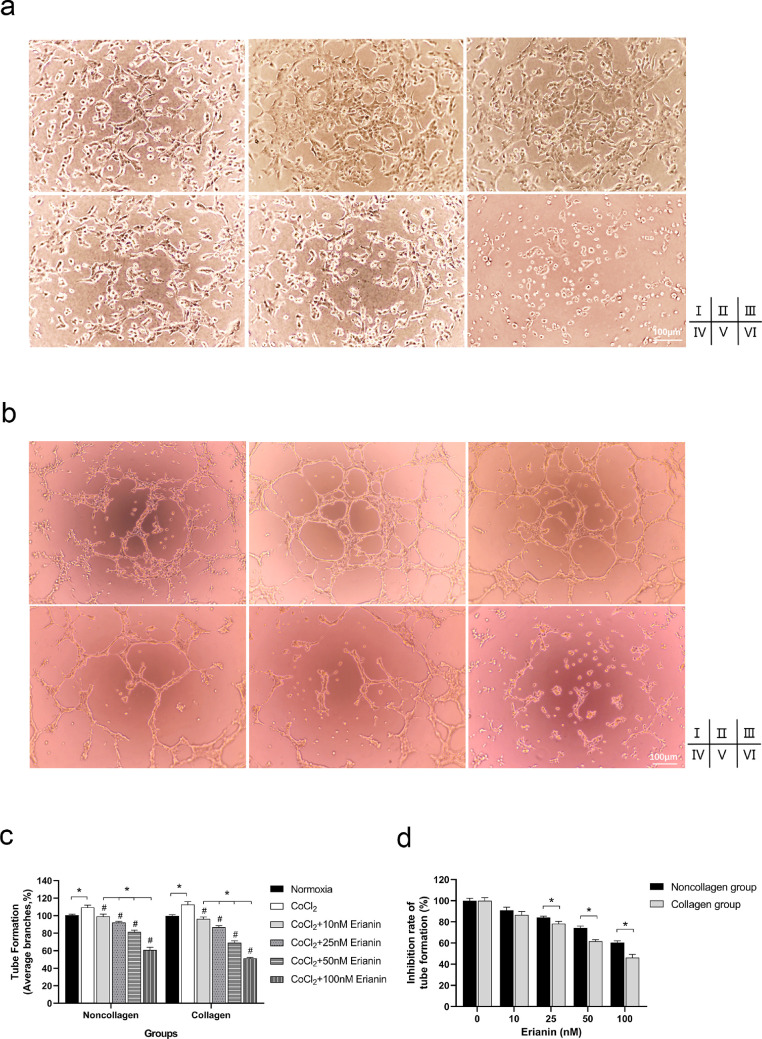
Fig. 5
Effect of erianin on tube formation of HRVECs. (A) Tube formation of collagen-cultured HRVECs exposed to DMEM (Ⅰ), CoCl2 (Ⅱ), or erianin at various concentrations (10 nM [Ⅲ], 25 nM [Ⅳ], 50 nM [Ⅴ], and 100 nM [Ⅵ] [100 ×). (B) Tube formation of noncollagen-cultured HRVECs exposed to DMEM (Ⅰ), CoCl2 (Ⅱ), or erianin at various concentrations (10 nM [Ⅲ], 25 nM [Ⅳ], 50 nM [Ⅴ], 100 nM [Ⅵ] 100 ×). (C) Comparison of cell tube formation among collagen groups and among noncollagen groups. The normoxia group was set as the control at 100%. (D) The inhibition rate of tube formation was compared between hypoxic HRVECs cultured under collagen and noncollagen conditions. Hypoxic cells without erianin treatment were set as the controls at 100%. * Significant difference between samples (paired t-test, P values < 0.05); # Significant difference compared with CoCl2-incubated cells without erianin treatment (paired t-test, P values < 0.05); † Significant difference between collagen- and noncollagen-culture group (independent sample t-test, P values < 0.05).