
Fig. 11
- ID
- ZDB-FIG-230207-39
- Publication
- Li et al., 2022 - Erianin Controls Collagen-Mediated Retinal Angiogenesis via the RhoA/ROCK1 Signaling Pathway Induced by the alpha2/beta1 Integrin-Collagen Interaction
- Other Figures
- All Figure Page
- Back to All Figure Page
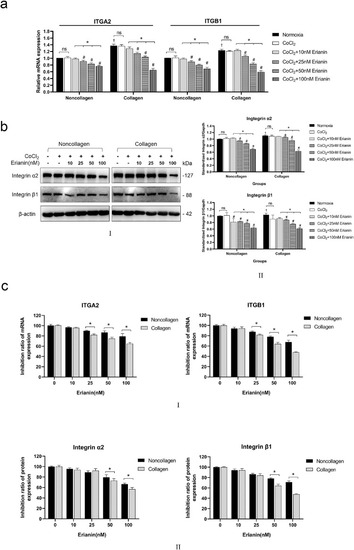
Effects of erianin on α2 and β1 integrins in vitro. (A) The mRNA levels of ITGA2 and ITGB1 in HRVECs exposed to normoxia, CoCl2, or erianin at various concentrations. (B) (B–I) Protein levels of α2 and β1 integrins in HRVECs exposed to normoxia, CoCl2, or erianin at various concentrations. (B–II) Quantitative analysis of α2 and β1 integrins; the results are presented as percentages of the normoxia group. (C) (C–I) The inhibition ratios of ITGA2 and ITGB1 were compared between hypoxic HRVECs cultured under collagen and noncollagen conditions and treated with erianin at various concentrations. (C–II) The inhibition ratios of α2 and β1 integrin proteins were compared between hypoxic HRVECs cultured under collagen and noncollagen conditions and treated with erianin at various concentrations. Hypoxic cells without erianin treatment were set as controls at 100%. * Significant difference between samples (paired t-test, P values < 0.05); # Comparison with the noncollagen group of CoCl2-incubated cells without erianin treatment (paired t-test, P values < 0.05); † Comparison with the noncollagen group of normoxia cells without erianin treatment (independent sample t-test, P values < 0.05); $ Significant difference between collagen and noncollagen groups (independent sample t-test, P values < 0.05; ITGA2: integrin subunit alpha 2 [human]; ITGB1: integrin subunit beta 1 [human]). |