
|
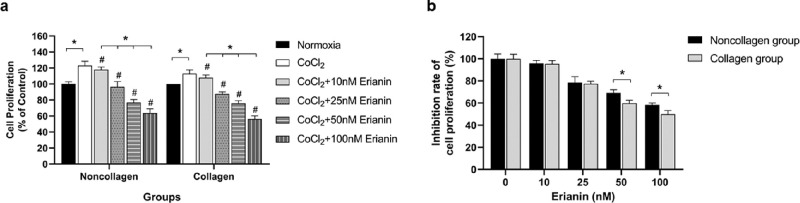
Fig. 3
Effect of erianin on the proliferation of HRVECs induced by CoCl2 for 24 h ours . Cell proliferation was determined by CCK-8 assay. (A) HRVECs were treated with erianin at various concentrations (0–100 nM). Comparison of the inhibition rate of cell proliferation among collagen groups and among noncollagen groups. The normoxia group without erianin treatment was set as the control at 100%. (B) The inhibition rate of cell proliferation was compared between hypoxic HRVECs cultured under collagen and noncollagen conditions. Hypoxic cells without erianin treatment were set as the control at 100%. * Significant difference between samples (paired t-test, P values < 0.05); # Significant difference compared with CoCl2-incubated cells without erianin treatment (paired t-test, P values < 0.05). † Significant difference between collagen- and noncollagen-culture groups (independent sample t-test, P values < 0.05).