
|
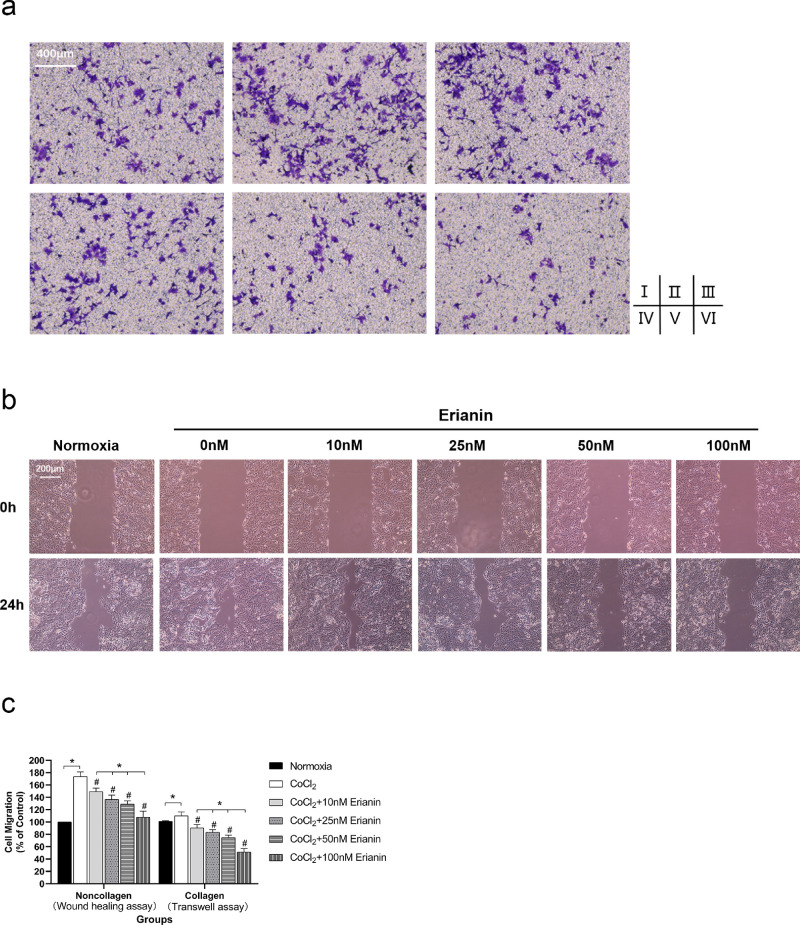
Fig. 4
Effect of erianin on HRVEC migration. (A) Collagen-cultured hypoxic HRVEC migration was evaluated by Transwell assay (100 ×). (Ⅰ) Cells without CoCl2 and erianin exposure; (Ⅱ) cells with CoCl2 and without erianin exposure; hypoxic cells exposed to erianin at various concentrations of 10 nM (Ⅲ), 25 nM (Ⅳ), 50 nM (Ⅴ), and 100 nM (Ⅵ). (B) Cell migration of noncollagen-cultured HRVECs evaluated by wound healing assays (100 ×). (C) Comparison of the inhibition rate of cell migration among collagen groups and among noncollagen groups. The normoxia group was set as the control at 100%. * Significant difference between samples (paired t-test, P values < 0.05); # Significant difference compared with CoCl2-incubated cells without erianin treatment (paired t-test, P values < 0.05).