
- Title
-
Fgf3 is crucial for the generation of monoaminergic cerebrospinal fluid contacting cells in zebrafish
- Authors
- Reuter, I., Jäckels, J., Kneitz, S., Kuper, J., Lesch, K.P., Lillesaar, C.
- Source
- Full text @ Biol. Open
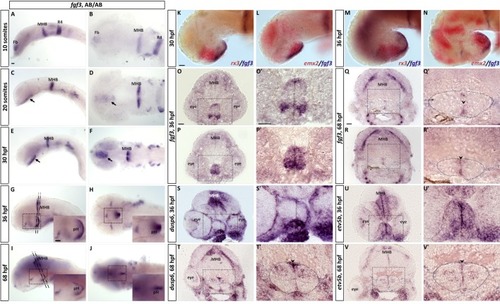
EXPRESSION / LABELING:
|
|
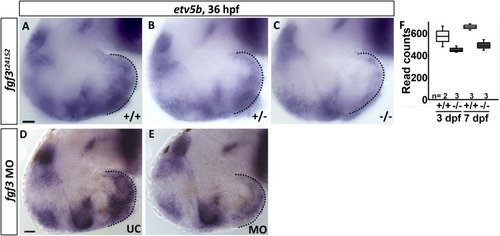
EXPRESSION / LABELING:
PHENOTYPE:
|
EXPRESSION / LABELING:
PHENOTYPE:
|
EXPRESSION / LABELING:
PHENOTYPE:
|
|
|
|
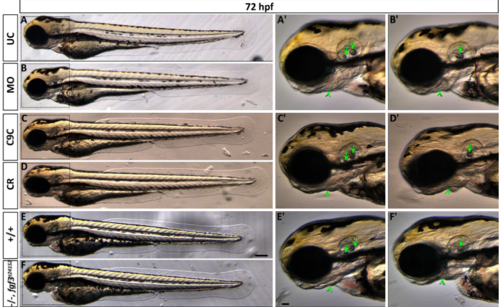
Live images showing morphology of 72 hpf embryos after fgf3 impairment with characteristic ear and craniofacial malformations. (A,B) Uninjected control (UC) and fgf3 morpholino injected (MO) siblings. (C,D) Cas9 injected control (C9C) and fgf3 CRISPR/Cas9 injected (CR) siblings. (E,F) Wildtype (+/+) and homozygous fgf3t24152 mutant (-/-) siblings. Boxes indicate magnified area shown in A’-F’. After fgf3 impairment the two otoliths fuse (arrow) and the lower jaw bones are malformed (arrow heads). Lateral views, anterior to the left. Scale bar in E, 100 μm; in E’, 50 μm. PHENOTYPE:
|
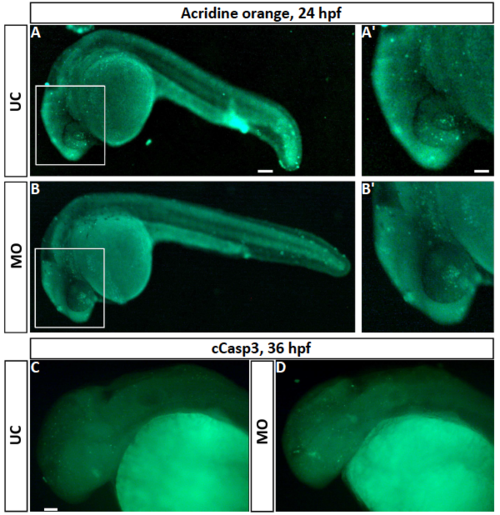
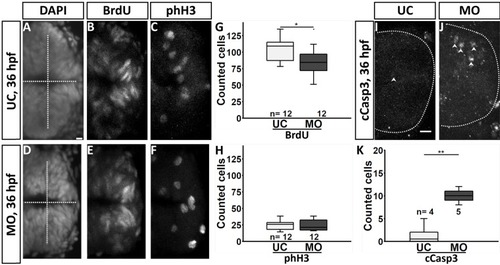
Fluorescence pictures showing cell death in fgf3 morphants. (A,B) Live images of acridine orange stained uninjected control (UC) and morphant (MO) siblings at 24 hpf. A’ and B’ are high magnifications of boxed areas in A and B. (C,D) Cleaved caspase 3 (cCasp3) immuno stained control and morphant siblings at 36 hpf. Lateral views, anterior to the left. Scale bar in A, 100 μm; in A’ and C 50 μm |
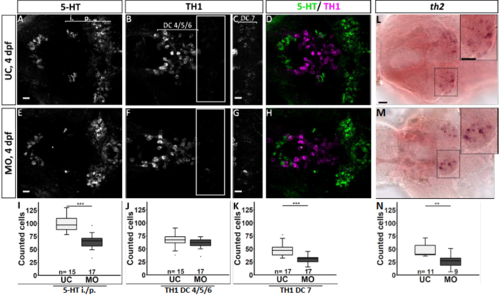
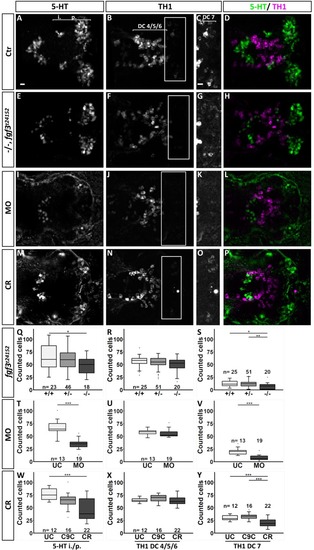
Quantification of the number of serotonergic cells in the intermediate (i.)/posterior (p.) clusters and of dopaminergic cells in the DC 4/5/6 and DC 7 clusters in the hypothalamus of fgf3 morphants at 4 dpf. (AH) Confocal maximum intensity projections from uninjected control (UC) and morpholino injected (MO) siblings immuno stained for 5-HT (green) and TH1 (magenta) shown as single channels and merged. C and G show boxed areas in B and F, respectively, with adjusted brightness and contrast to reveal the faint TH1 immunoreactive cells of the DC 7 cluster. (L, M) Light microscopic pictures of fgf3 morphants and uninjected control siblings processed for RNA in situ hybridisation for th2 expressed by dopaminergic cells intermingled with TH1 positive cells in the DC7 cluster. Insets show high magnifications of boxed areas. Ventral views, anterior to the left. Scale bars in A,E,C,G, 10 μm; in L, 30 μm. (I-K, N) Quantifications of 5-HT, TH1 and th2 positive cells in control and morphant siblings. The number of serotonergic cells was counted in the i./p. clusters as indicated by the line in A. The number of dopaminergic (TH1 and th2) cells was counted in the DC 4/5/6 and DC 7 clusters as indicated by the lines in B and C, respectively. Tukey boxplots showing median, 25-75% percentile, IQR whiskers and outliers. n = number of analysed individuals. |

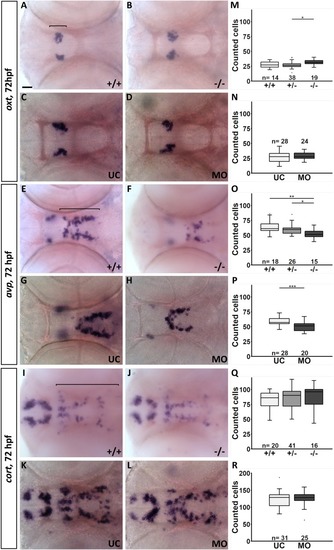
The shape of the hypothalamic nkx2.4b domain is altered in fgf3 morphants. (A-F) Light microscopic pictures showing expression of nkx2.4b in fgf3 morphants (MO) and uninjected control siblings (UC) at 36, 48 and 72 hpf visualised by RNA in situ hybridisation. Outlines of semi-automated measurement of hypothalamic area are highlighted in blue. Lateral views, anterior to the left. Scale bar = 30 μm. (G-I) Area measurements (pixels) in fgf3 morphants and control siblings of the nkx2.4b domain at 36, 48 and 72 hpf. (J) Total length measurements of fgf3 morphants and control siblings at 72 hpf. Tukey boxplots showing median, 25-75% percentile, IQR whiskers and outliers. n= number of analysed individuals. (K) Scheme illustrating the lateral and ventral silhouette of the nkx2.4b expressing hypothalamic domain at 36, 48 and 72 hpf. Dark grey indicates location of monoaminergic populations around the posterior recess (PR). Dashed lines show hypothalamic ventricular system with the (LR) lateral recess and the PR. PHENOTYPE:
|