
Fig. 3.
- ID
- ZDB-IMAGE-190723-2002
- Antibodies
- Publication
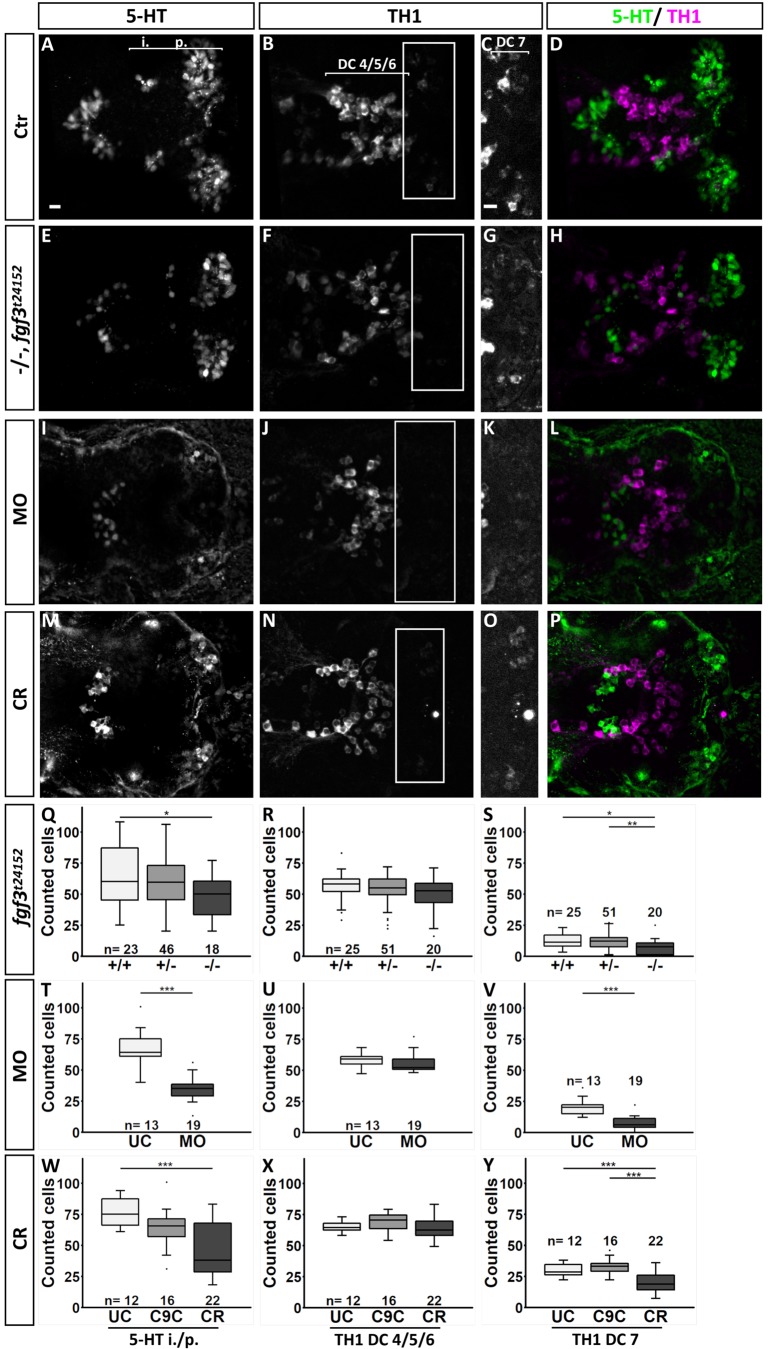
- Reuter et al., 2019 - Fgf3 is crucial for the generation of monoaminergic cerebrospinal fluid contacting cells in zebrafish
- All Figures
- Figures for Reuter et al., 2019
|
Fig. 3.