
- Title
-
miR-9 Controls the Timing of Neurogenesis through the Direct Inhibition of Antagonistic Factors
- Authors
- Coolen, M., Thieffry, D., Drivenes, O., Becker, T.S., and Bally-Cuif, L.
- Source
- Full text @ Dev. Cell

miR-9 Expression Encompasses Different Progenitor Commitment Stages across the Hindbrain Ventricular Zone (A–G) Comparison of the endogenous expression of miR-9 along the hindbrain ventricular zone (purple) with the miR-9-2:GFP line (green) and GFAP (light blue), seen in a transverse section. (D2) is a higher magnification of the region boxed in (D). Some GFP-positive cells display a long cellular extension reaching the pial surface and stained with the GFAP antibody (B–D, white arrowhead). (D2) GFP-positive cells can be distinguished in the brainstem, some of them expressing endogenous miR-9 (white arrows) and some not (asterisks). A GFAP signal can also be detected in cell bodies of GFP-expressing cells along the ventricle (E–G, orange arrowheads). (H and I) miR-9 endogenous expression in the hindbrain at 48 hpf (blue) in dorsal view (H) and sagittal section (I). Vertical dotted lines indicate rhombomere boundaries. (J–O2) Endogenous expression of miR-9 (purple), compared to GFP in the neurog1:GFP line (green). (J–L) Dorsal views. (M–O) Transverse section. (M2–O2) Higher magnifications of the region in the white square indicated in (M–O). White arrows in (J–L) indicate stripes of miR-9/GFP expression on both sides of a rhombomere boundary. Purple arrows in (N) highlight columns of miR-9-expressing cells in the mantle zone. (P) Schematized summary of miR-9 expression (orange), which encompasses radial glia progenitors (blue) and committed precursors (green), but excludes differentiated neurons (red). MHB, midbrain-hindbrain boundary. See also Figure S1. |
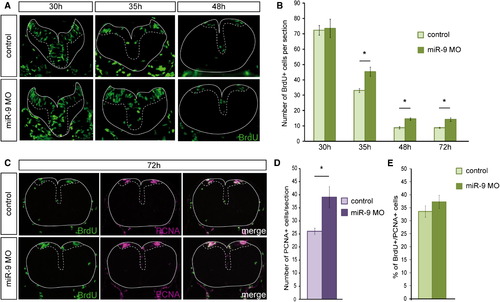
miR-9 Depletion Increases Proliferation along the Hindbrain VZ at Late Stages (A) Transverse sections showing short pulse BrdU labeling of control and miR-9 MO-injected embryos at 30 hpf, 35 hpf, and 48 hpf. (B) Number of BrdU-positive cells per 5-μm section at 30 (n = 4 embryos per condition), 35 (n = 6), 48 (n = 9), 72 hpf (n = 9) in control or injected embryos. (C) Transverse sections showing BrdU (green) and PCNA (purple) immunostaining after short pulse labeling at 72 hpf (n = 9). (D) Number of PCNA-positive cells per 5-μm section. (E) Proportion of BrdU-positive cells among PCNA-positive cells. The VZ is highlighted with a dotted line. p < 0.01. Values are presented as mean ± SEM. See also Figure S2. EXPRESSION / LABELING:
PHENOTYPE:
|
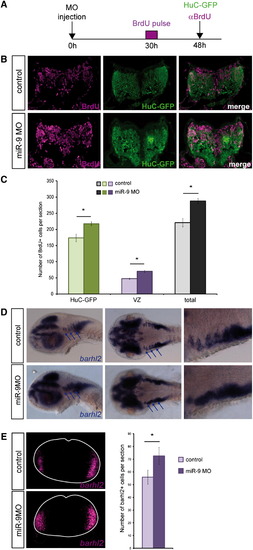
miR-9 Knockdown Delays Cell-Cycle Exit, Leading to the Amplification of Late-Born Neuronal Populations (A) Scheme illustrating the experimental procedure. (B) Transverse sections showing immunohistochemical detection of BrdU (purple) and GFP in the HuC:GFP line in a pulse chase experiment between 30 and 48 hpf. (C) Comparison of the number of BrdU-positive cells that are also HuC-GFP-positive (green bars) or not (purple bars), or the total number of BrdU-positive cells per section (gray and black bars) between control (light colors) and morphant embryos (dark colors) (n = 7). (D) Expression of barhl2 in control and miR-9 MO injected embryos at 48 hpf. The left panels are lateral views, the middle panels are dorsal views, and the right panels are higher magnification of the latter, in the anterior hindbrain. (E) Number of Barhl2-positive cells per 5-μm section at 48 hpf (n = 5). p < 0.01. Values are presented as mean ± SEM. See also Figure S3. |
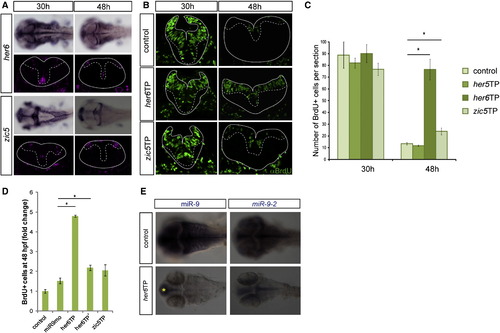
miR-9 Inhibits Proliferation through Direct Inhibition of her6 and zic5 (A) Expression of her6 and zic5 at 35 hpf and 48 hpf in the zebrafish hindbrain (upper panels: dorsal views; lower panels: transverse sections). (B) Transverse sections after a short pulse BrdU labeling (green) at 30 hpf or 48 hpf. (C) Number of BrdU-positive cells per 5-µm section at the indicated stages (n = 8). (D) Increase in the number of BrdU+ cells represented as fold changes from control injected embryos. Note that both her6TP morpholinos lead to a significantly stronger increase in proliferation than miR-9 morpholino. (E) Expression of miR-9, miR-9-2 in control, and her6TP-injected embryos at 48 hpf. The yellow asterisk indicates remaining miR-9 expression in the telencephalon. Values are presented as mean ± SEM. See also Figure S4. |
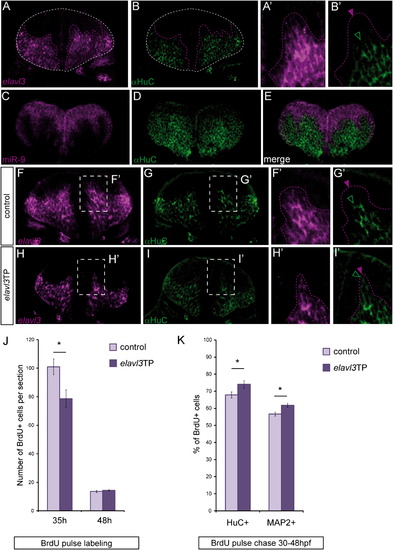
miR-9 Inhibits the Neuronal Differentiation Promoting Factor elavl3 (A–B2) Comparison of elavl3 transcripts distribution (A, purple) with a HuC expression (B, green) in a cross section through the hindbrain at 36 hpf. (A2) and (B2) are higher magnifications of the pictures shown in (A) and (B). (C–E) Comparison of miR-9 expression (purple) with HuC (green). (F–I and F2–I2) Comparison of elavl3 transcript (purple) and HuC/D protein (green) distribution between control (F, G, F2, G2) and elavl3TP injected embryos (H, I, H2, I2). Purple and green arrowheads (B2, F2, G2, H2, I2) point to the limits of respectively elavl3 transcripts and HuC protein expression domains. (J) Number of BrdU-positive cells per section after a short BrdU pulse at 35 hpf (n = 5) and 48 hpf (n = 4). (K) Proportion of HuC-positive or MAP2-positive cells among BrdU-positive cells in a BrdU pulse-chase experiment between 30 hpf and 48 hpf, in control and elavl3TP-injected embryos (n = 5 and n = 8). Values are presented as mean ± SEM. See also Figure S5. |
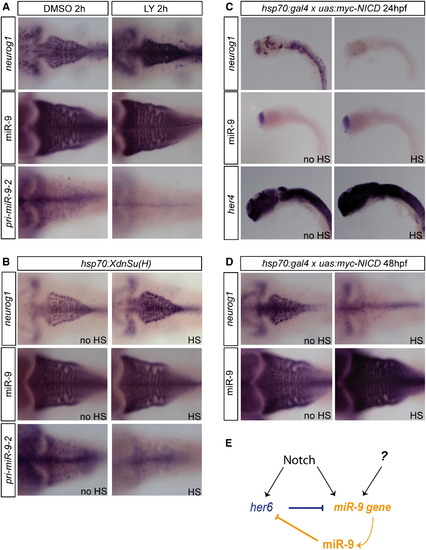
miR-9 Expression Is Regulated by Notch Signaling (A) Expression of neurog1, miR-9, and miR-9-2 in 48 hpf embryos after a 2 h DMSO (left panels) or 10 μM LY411575 treatment (right panels). (B) Expression of neurog1, miR-9, and miR-9-2 in Tg(hsp70:XdnSu(H)) embryos following a heat-shock induction at 48 hpf (HS, right panels) or without any induction (no HS, left panels). (C) Expression of neurog1, miR-9, and her4 in Tg(hsp70l:Gal4)/+;Tg(UAS:myc-NICD)/+ embryos following a heat-shock induction at 24 hpf (HS, right panels) or without any induction (no HS, left panels). (D) Expression of neurog1 and miR-9 in Tg(hsp70l:Gal4)/+;Tg(UAS:myc-NICD)/+ embryos following a heat-shock induction at 48 hpf (HS, right panels) or without any induction (no HS, left panels). (E) Model of regulation of miR-9 by Notch signaling. See also Figure S6. |

Complementary information on miR-9-2:GFP and neurog1:GFP lines (related to figure 1): This figure describe in detail the pattern of transgene expression in the miR-9-2:GFP line described for the first time in this paper. This line was used to analyze the identity of miR-9 expressing cells as shown in figure 1. It also shows how expression of GFP in the neurog1:GFP line compares to the endogenous neurog1 and ascl1a transcripts in the late embryonic hindbrain. Expression of neurog1:GFP was compared to miR-9 expression in figure 1. |
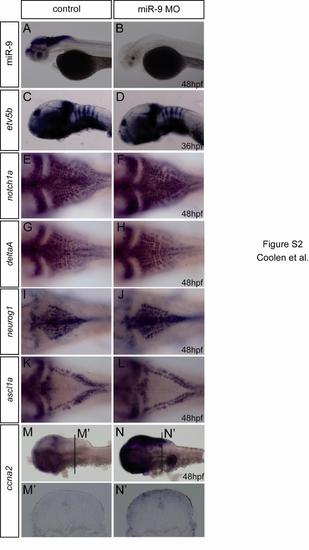
Control experiments for miR-9 morpholino effects (related to figure 2) This figure shows that miR-9 morpholino blocks efficiently miR-9 and show that the overall patterning of the hindbrain is not affected in miR-9 morphants. It also further confirms the conclusions drawn from data presented in figure 2, demonstrating that miR-9 morpholino induces an increase in proliferation, using a different marker, ccna2. |
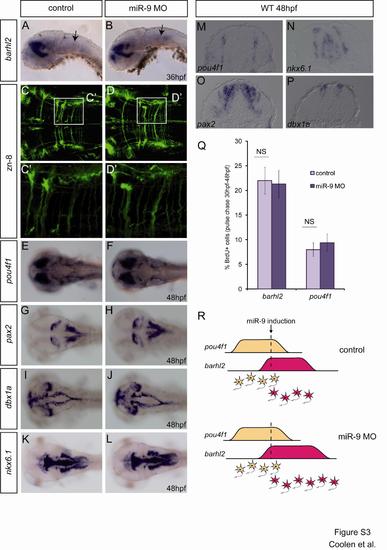
Effect of miR-9 depletion on different neuronal populations (related to figure 3) This figure shows that no obvious effect could be observed on the differentiation of different neuronal populations, in contrast with what we show in figure 3 for the barhl2 positive population. |
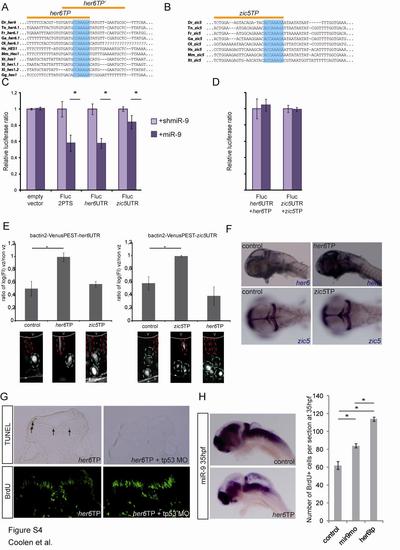
Validation of her6 and zic5 target protectors (related to figure 4) This figure presents experiments validating her6 and zic5 target protectors used in this study. |
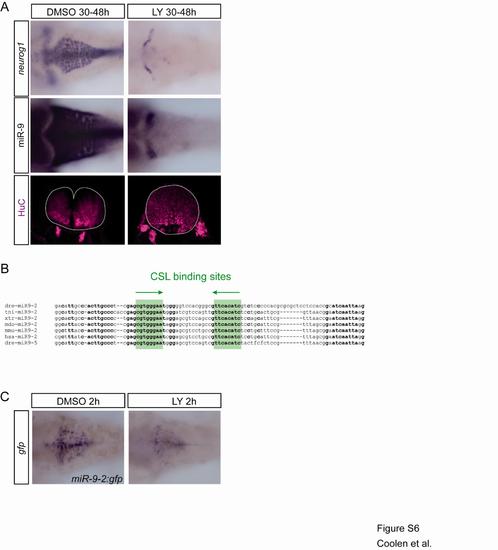
Regulation of miR-9 expression by Notch signaling (related to figure 6) This figure presents the effect of a long term treatment with the gamma secretase inhibitor LY411575 on miR-9 and the localisation of putative su(H) binding sites on miR-9-2 promoter. |
Reprinted from Developmental Cell, 22(5), Coolen, M., Thieffry, D., Drivenes, O., Becker, T.S., and Bally-Cuif, L., miR-9 Controls the Timing of Neurogenesis through the Direct Inhibition of Antagonistic Factors, 1052-1064, Copyright (2012) with permission from Elsevier. Full text @ Dev. Cell