
Fig. 3
- ID
- ZDB-IMAGE-120525-42
- Genes
- Publication
- Coolen et al., 2012 - miR-9 Controls the Timing of Neurogenesis through the Direct Inhibition of Antagonistic Factors
- All Figures
- Figures for Coolen et al., 2012
|
Fig. 3
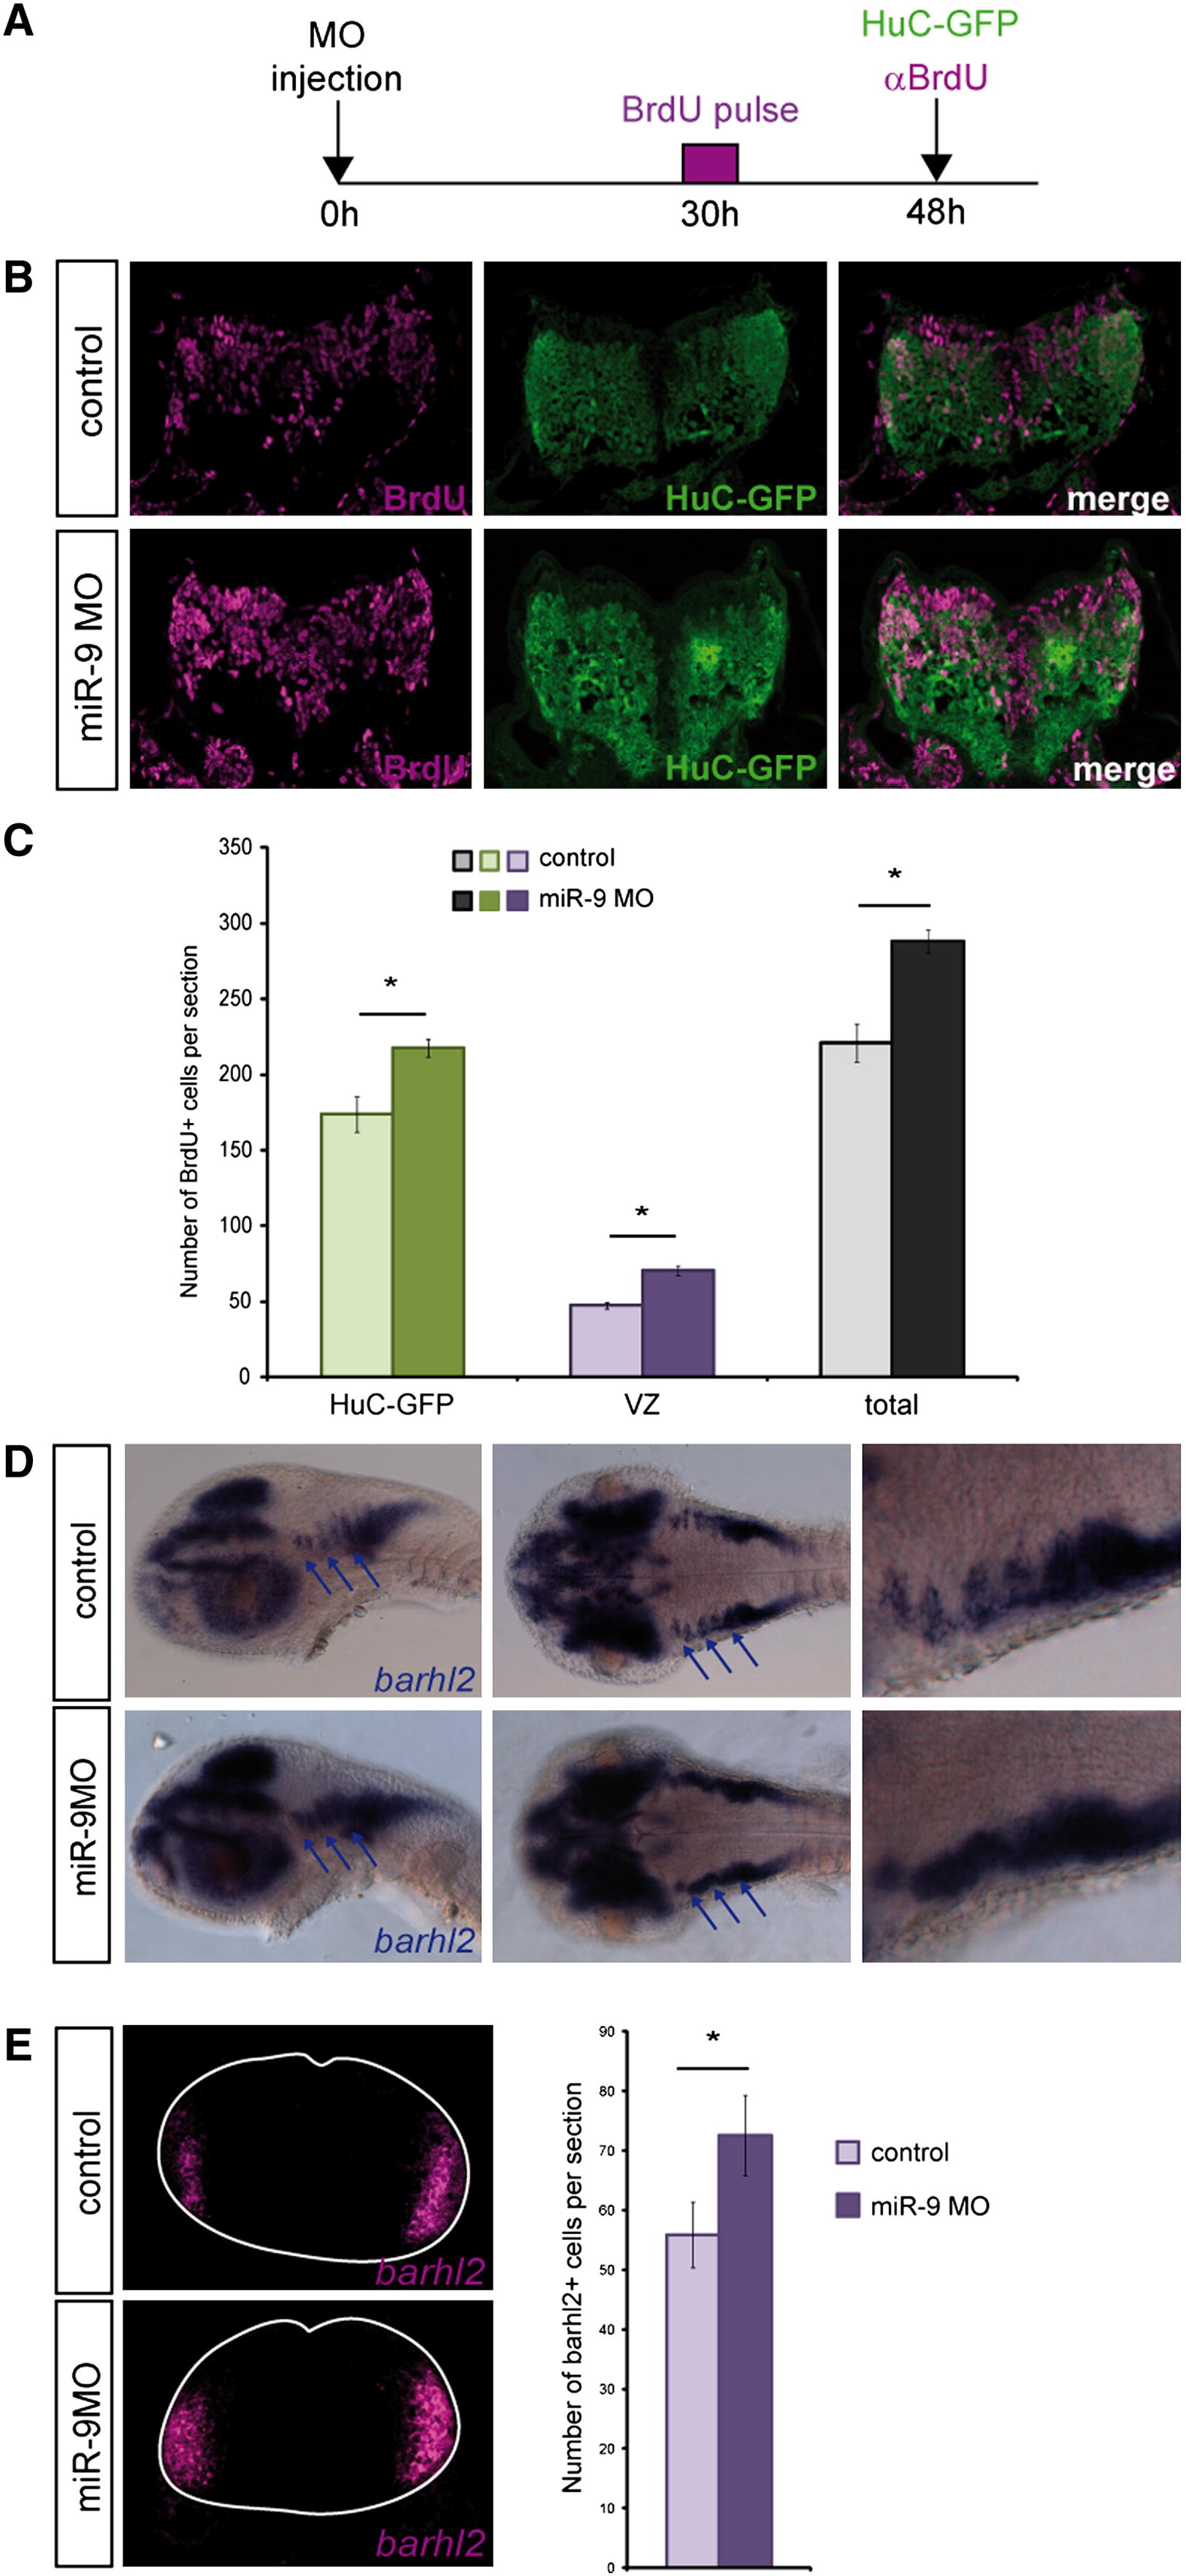
miR-9 Knockdown Delays Cell-Cycle Exit, Leading to the Amplification of Late-Born Neuronal Populations (A) Scheme illustrating the experimental procedure. (B) Transverse sections showing immunohistochemical detection of BrdU (purple) and GFP in the HuC:GFP line in a pulse chase experiment between 30 and 48 hpf. (C) Comparison of the number of BrdU-positive cells that are also HuC-GFP-positive (green bars) or not (purple bars), or the total number of BrdU-positive cells per section (gray and black bars) between control (light colors) and morphant embryos (dark colors) (n = 7). (D) Expression of barhl2 in control and miR-9 MO injected embryos at 48 hpf. The left panels are lateral views, the middle panels are dorsal views, and the right panels are higher magnification of the latter, in the anterior hindbrain. (E) Number of Barhl2-positive cells per 5-μm section at 48 hpf (n = 5). p < 0.01. Values are presented as mean ± SEM. See also Figure S3.
Reprinted from Developmental Cell, 22(5), Coolen, M., Thieffry, D., Drivenes, O., Becker, T.S., and Bally-Cuif, L., miR-9 Controls the Timing of Neurogenesis through the Direct Inhibition of Antagonistic Factors, 1052-1064, Copyright (2012) with permission from Elsevier. Full text @ Dev. Cell