
Fig. 4
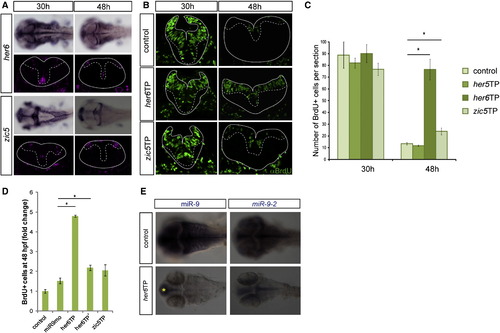
miR-9 Inhibits Proliferation through Direct Inhibition of her6 and zic5 (A) Expression of her6 and zic5 at 35 hpf and 48 hpf in the zebrafish hindbrain (upper panels: dorsal views; lower panels: transverse sections). (B) Transverse sections after a short pulse BrdU labeling (green) at 30 hpf or 48 hpf. (C) Number of BrdU-positive cells per 5-µm section at the indicated stages (n = 8). (D) Increase in the number of BrdU+ cells represented as fold changes from control injected embryos. Note that both her6TP morpholinos lead to a significantly stronger increase in proliferation than miR-9 morpholino. (E) Expression of miR-9, miR-9-2 in control, and her6TP-injected embryos at 48 hpf. The yellow asterisk indicates remaining miR-9 expression in the telencephalon. Values are presented as mean ± SEM. See also Figure S4. |
| Genes: | |
|---|---|
| Fish: | |
| Knockdown Reagent: | |
| Anatomical Terms: | |
| Stage Range: | Prim-15 to Long-pec |
| Fish: | |
|---|---|
| Knockdown Reagents: | |
| Observed In: | |
| Stage Range: | Prim-15 to Long-pec |
Reprinted from Developmental Cell, 22(5), Coolen, M., Thieffry, D., Drivenes, O., Becker, T.S., and Bally-Cuif, L., miR-9 Controls the Timing of Neurogenesis through the Direct Inhibition of Antagonistic Factors, 1052-1064, Copyright (2012) with permission from Elsevier. Full text @ Dev. Cell