
IMAGE
Fig. S1
- ID
- ZDB-IMAGE-120525-46
- Publication
- Coolen et al., 2012 - miR-9 Controls the Timing of Neurogenesis through the Direct Inhibition of Antagonistic Factors
- All Figures
- Figures for Coolen et al., 2012
Image
|
Figure Caption
Fig. S1
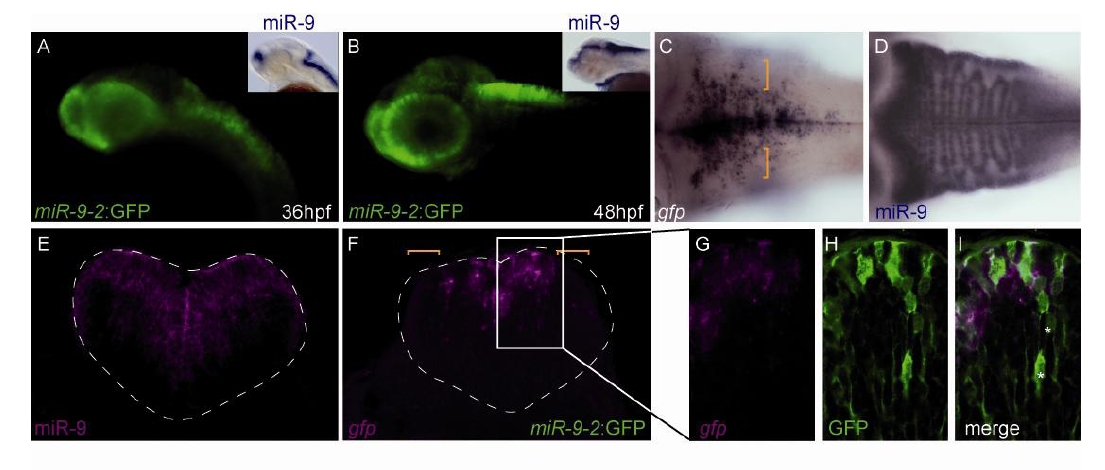
Complementary information on miR-9-2:GFP and neurog1:GFP lines (related to figure 1):
This figure describe in detail the pattern of transgene expression in the miR-9-2:GFP line described for the first time in this paper. This line was used to analyze the identity of miR-9 expressing cells as shown in figure 1. It also shows how expression of GFP in the neurog1:GFP line compares to the endogenous neurog1 and ascl1a transcripts in the late embryonic hindbrain. Expression of neurog1:GFP was compared to miR-9 expression in figure 1.
Acknowledgments
This image is the copyrighted work of the attributed author or publisher, and
ZFIN has permission only to display this image to its users.
Additional permissions should be obtained from the applicable author or publisher of the image.
Reprinted from Developmental Cell, 22(5), Coolen, M., Thieffry, D., Drivenes, O., Becker, T.S., and Bally-Cuif, L., miR-9 Controls the Timing of Neurogenesis through the Direct Inhibition of Antagonistic Factors, 1052-1064, Copyright (2012) with permission from Elsevier. Full text @ Dev. Cell