
- Title
-
Infection-Responsive Expansion of the Hematopoietic Stem and Progenitor Cell Compartment in Zebrafish Is Dependent upon Inducible Nitric Oxide
- Authors
- Hall, C.J., Flores, M.V., Oehlers, S.H., Sanderson, L.E., Lam, E.Y., Crosier, K.E., and Crosier, P.S.
- Source
- Full text @ Cell Stem Cell
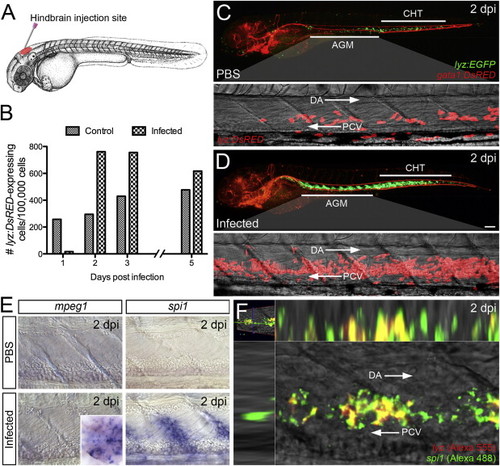
Larval Hematopoietic Response to Infection (A) Schematic illustrating hindbrain injection site of live GFP-labeled Salmonella. (B) Quantities of whole-larvae lyz:DsRED-expressing cells (per 100,000 sorted cells), as determined by flow cytometry, within infected Tg(lyz:DsRED) larvae (600 cfu) at 1, 2, 3, and 5 dpi, compared with PBS controls (n = 50 larvae/sample). (C and D) Enhanced granulopoiesis within the AGM and CHT of infected (600 cfu) Tg(lyz:EGFP)/Tg(gata1:DsRED) larvae at 2 dpi, relative to PBS controls (with magnified views of AGM region within similarly treated Tg(lyz:DsRED) larvae). (B)?(D) refer only to those infected larvae that displayed neutrophil depletion at 1 dpi (see Supplemental Experimental Procedures). (E) Expression of mpeg1 and spi1 within the AGM at 2 dpi following infection, compared with PBS controls. Inset demonstrates mpeg1-expressing cells within the midbrain and hindbrain. (F) Dual WMISH of lyz and spi1 expression within the AGM following infection at 2 dpi. All views, anterior to left. Scale bar, 100 μm in (D). Abbreviations: AGM, aorta-gonad-mesonephros; CHT, caudal hematopoietic tissue; DA, dorsal aorta; PCV, posterior cardinal vein. See also Figure S1. |

HSPC Compartment Expands in Response to Infection (A) Confocal imaging through the AGM of control MO- and Runx1 MO-injected Tg(lyz:DsRED)/Tg(runx1P2:EGFP) larvae following infection, compared with PBS controls at 2 dpi. (B) Expression of cmyb within the AGM of uninjected, PBS control and infected larvae at 2 dpi. (C) Quantification of cmyb-expressing cells within the AGM (as defined in schematic) of larvae shown in (B); arrowhead marks somite boundary that intersects cloaca. (D) Quantification of dual-labeled HSPCs (marked by asterisks) within the subaortic space of infected Tg(runx1P2:EGFP)/Tg(kdrl:nls-mCherry) larvae, compared with PBS controls at 1 and 2 dpi. All views, anterior to left. Numbers represent frequency of embryos or larvae with displayed phenotype. Scale bar, 50 μm in (A). Abbreviations: DA, dorsal aorta; PCV, posterior cardinal vein; *p < 0.05; **p < 0.01; ***p < 0.001. See also Figure S2. |

Demand-Driven Granulopoiesis Is Dependent upon Gcsf/Gcsfr Signaling (A) Expression of gcsf within the midbrain and hindbrain of infected larvae (marked by arrows), dorsal views, compared with PBS controls at 1 and 2 dpi. (B) Expression of gcsfr within the AGM of infected larvae, compared with PBS controls at 1 and 2 dpi. (C?E) Dual WMISH of gcsf and lyz, and lcp1 and apoeb, respectively, within the midbrain and hindbrain at 2 dpi following infection, with dorsal views shown. (F) Control MO- and Gcsfr MO-injected Tg(lyz:EGFP)/Tg(gata1:DsRED) larvae following injection of heat-shocked Salmonella (H.S. Sal.), compared with PBS controls at 2 dpi. Numbers represent frequency of embryos or larvae with displayed phenotype. Scale bar, 100 μm in (F). See also Figure S3. |

cebpβ Is Expressed within HSPCs in Response to Infection and Is Required for Demand-Driven Granulopoiesis (A) Expression of cebpβ within the AGM of infected larvae, compared with PBS controls at 12 hpi and 2 dpi. (B) Dual WMISH of cebpβ and runx1 within the AGM of infected larvae at 12 hpi. (C) Dual WMISH of cebpβ and lyz within the AGM of infected larvae at 2 dpi. (D) Control MO- and C/ebpβ MO-injected Tg(lyz:EGFP)/Tg(gata1:DsRED) larvae following infection, compared with PBS controls at 2 dpi. Numbers represent frequency of embryos or larvae with displayed phenotype. Scale bar, 100 μm in (D). All views, anterior to left. Abbreviations: DA, dorsal aorta; PCV, posterior cardinal vein. See also Figure S4. |

Demand-Driven Granulopoiesis and HSPC Expansion Are Dependent upon Nos2a Relative frequency of infected larvae demonstrating demand-driven granulopoiesis following treatment (from 6 hpi) with the NOS inhibiting drugs L-NAME (A), ODQ (B), 1400W (C), and S-Methyl-L-thiocitrulline (D), all relative to DMSO control treatment. Numbers represent numbers of larvae in each treatment group. (E) Expression of nos2a within the AGM of infected larvae, compared with PBS controls at 1 and 2 dpi. (F) Dual WMISH of nos2a and lyz within the AGM of infected larvae at 2 dpi. (G?I) DAF-FM DA detection of NO within control MO-injected PBS control, control MO-injected infected, and Nos2a MO-injected infected Tg(lyz:DsRED) larvae, respectively, at 2 dpi. Yellow and red asterisks mark lyz+/NO+ and lyz+/NO* cells, respectively. (J) Percentage of control MO- and Nos2a MO-injected Tg(lyz:DsRED) infected larvae demonstrating demand-driven granulopoiesis at 2 dpi. (K) Number of cmyb-expressing HSPCs, as detected by WMISH at 2 dpi, within the AGM compartment (as defined in Figure 2C) following indicated treatments. (L) Quantification of dual-labeled HSPCs within the subaortic space of 2 dpi Tg(runx1P2:EGFP)/Tg(kdrl:nls-mCherry) larvae following indicated treatments. Numbers represent frequency of embryos or larvae with displayed phenotype. All views, anterior to left. Scale bar, 50 μm in (F). Abbreviations: DA, dorsal aorta; PCV, posterior cardinal vein; n.s., not significant; **p < 0.01; ***p < 0.001. See also Figure S5. EXPRESSION / LABELING:
PHENOTYPE:
|

Nos2a Functions Downstream of C/ebpβ during Demand-Driven Granulopoiesis (A) Expression of nos2a within the AGM of control MO- and C/ebpβ MO-injected larvae following infection, compared with PBS controls at 2 dpi. (B) Expression of cebpβ within the AGM of control MO- and Nos2a MO-injected larvae following infection, compared with PBS controls at 2 dpi. (C) Expression of nos2a at 22 hpf, following injection of 50 pg cebpβ mRNA. (D) Dual WMISH of cebpβ and nos2a and immunofluorescence detection of lyz:EGFP within a Tg(lyz:EGFP) embryo at 22 hpf, following injection of 50 pg cebpβ mRNA. (E-G) lyz:EGFP-expressing myeloid progenitors on the yolk of noninjected, cebpβ mRNA-injected, and cebpβ mRNA/Nos2a MO-injected Tg(lyz:EGFP) embryos at 22 hpf, respectively. (H) Quantification of lyz:EGFP-expressing cells on the yolk of embryos in (E)-(G). Numbers represent frequency of embryos or larvae with displayed phenotype. All views, anterior to left. Scale bar, 10 μm in (D). Abbreviations: n.s., not significant; ***p < 0.001. See also Figure S6. EXPRESSION / LABELING:
|

(A) Time-lapse confocal imaging of neutrophil response to 300 cfu Sal-GFP injected into the hindbrain ventricle of Tg(lyz:DsRED) embryos at 50 hpf. (B) 3D reconstruction of A at 4 hpi; inset, magnified view of boxed neutrophil with cutting plane to reveal phagocytosed Sal-GFP. (C) Tg(lyz:DsRED) larvae 1 day following injection of 600 cfu Sal-GFP demonstrating either diminished neutrophil numbers or extensive bacterial burden, compared to PBS control. (D) Survival and demand-driven granulopoiesis frequency relative to infection dose. Percent survival (in black) relative to hindbrain injection dose (cfu) and % of surviving infected larvae demonstrating demand-driven granulopoiesis (in red) relative to infection dose (solid lines represent mean with 95% confidence interval dashed) as scored at 2 dpi. Light blue box highlights infection dose range used in this study. (E) QPCR expression analysis of lyz, mpx, csf1ra, lcp1 and spi1 within infected larvae at 2.25 and 3.25 dpi, relative to PBS controls, means standard ± errors. (F and G) Infected larvae demonstrate reduced lymphopoiesis. (F) Expression and quantification of ikaros-expressing cells within the AGM of uninjected (4 dpf), PBS control and infected larvae at 2dpi. (G) Confocal imaging through the thymus of Tg(lyz:DsRED)/Tg(lck:GFP) infected larvae (compared with PBS controls). Volumes of lck:GFP-expressing cells within the thymus are represented as mean standard deviation. Thymus reconstructions are paired with images through the AGM region of same larvae. All views, anterior to left. *, p-value<0.05; **, p-value<0.01; ***, p-value<0.001. Scale bars, 50μm in B and F. |
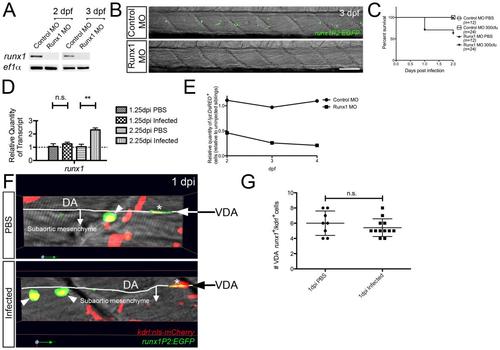
(A) RT-PCR detection of disrupted runx1 splicing at 2 and 3 dpf following Runx1 MO injection. (B) Confocal images through the AGM of control MO- and Runx1 MO-injected Tg(runx1P2:EGFP) larvae at 3 dpf. (C) Survival graph of control MO injected/PBS (n=12), control MO injected/300 cfu infected (n=24), Runx1 MO injected/PBS (n=12) and Runx1 MO injected/300 cfu infected (n=24). (D) QPCR analysis of runx1 expression at 1.25 and 2.25 dpi, relative to PBS controls, means standard ± errors. (E) Effect of Runx1-depletion on steady-state granulopoiesis. Relative quantities of whole-larvae fluorescent cells, as determined by flow cytometry, within Tg(lyz:DsRED) larvae at 2, 3 and 4 dpf following injection of control and Runx1-targeting MOs, relative to uninjected siblings. (F) Confocal imaging through the AGM region of PBS control and Infected Tg(runx1P2:EGFP)/Tg(kdrl:nls-mCherry) larvae (1 dpi) revealing no significant change in the number of VDA-localized dual fluorescent (runx1+kdrl+) putative hemogenic endothelial cells (G), marked with asterisks. Arrowheads mark dual-labeled subaortic HSPCs. All views, anterior to left. Scale bar, 50m in B. Abbreviations: n.s., not significant; DA, dorsal aorta; VDA, ventral dorsal aorta; **, p-value<0.01. EXPRESSION / LABELING:
|

QPCR expression analysis of csf1a (A), csf1b (B) and gscf (C) at 1.25 and 2.25 dpi following infection, relative to PBS controls, means standard errors. (D) RT-PCR detection of disrupted gcsfr splicing at 2, 3 and 4 dpf following Gcsfr MO injection. (E) Effect of Gcsfr-depletion on steady-state granulopoiesis. Relative quantities of whole-larvae fluorescent cells, as determined by flow cytometry, within Tg(lyz:DsRED) larvae at 2, 3 and 4 dpf following injection of control and Gcsfr-targeting MOs, relative to uninjected siblings. (F and G) Gcsfr-depleted larvae demonstrate reduced survival to live, but not heat-killed, Salmonella. (F) Survival graph of control MO injected/PBS (n=10), control MO injected/250 cfu infected (n=26), control MO injected/500 cfu infected (n=25), Gcsfr MO injected/PBS (n=20), Gcsfr MO injected/250 cfu infected (n=34) and Gcsfr MO injected/500 cfu infected (n=35). (G) Survival graph of control MO injected/PBS (n=45), control MO injected/heat-shocked Salmonella (H.S. Sal.) injected (n=45), Gscfr MO injected/PBS (n=25) and Gcsfr MO injected/ H.S. Sal. injected (n=23). Abbreviations: n.s., not significant; *, p-value<0.05; ***, p-value<0.001. |

(A) Relative frequency of infected larvae demonstrating demand-driven granulopoiesis following treatment (from 6 hpi) with the pan-NOS inhibiting drug L-NMMA, relative to DMSO control treatment. (B) Relative frequency of infected larvae demonstrating demand-driven granulopoiesis following treatment (from 6, 12, 24 and 36 hpi) with the NOS2-specific inhibiting drug 1400W, relative to DMSO control treatment. Numbers represent numbers of larvae in each treatment group. (C) RT-PCR detection of disrupted nos2a splicing at 1 and 2 dpi (infected) following Nos2a MO injection. (D) Percentage survival of Control MO- and Nos2a MO-injected larvae following infection, as scored at 2 dpi (means standard ± deviations). Individual data points represent individual infection experiments (mean n=45 for Control MO and n=54 for Nos2a MO infection experiments). Infection experiments were cfu dosage-matched between Control MO and Nos2a MO cohorts. (E) Control MO- and Nos2a MO-injected Tg(lyz:EGFP)/Tg(gata1:DsRED) larvae following infection, compared to PBS controls at 2dpi. Numbers represent frequency of larvae with displayed phenotype. (F) Effect of Nos2a-depletion on steady-state granulopoiesis. Relative quantities of whole-larvae fluorescent cells, as determined by flow cytometry, within Tg(lyz:DsRED) larvae at 2, 3 and 4 dpf following injection of control and Nos2a-targeting MOs, relative to uninjected siblings. All views, anterior to left. Scale bar, 100m in E. Abbreviation: n.s., not significant. |

Expression of cebpβ within the AGM of control MO- and Nos2a MO-injected larvae at 1dpi following infection, compared with PBS controls. Numbers represent frequency of embryos and larvae with displayed phenotype. All views anterior to left. Scale bar, 50μm. |