
Fig. 3
- ID
- ZDB-IMAGE-120209-13
- Genes
- Publication
- Hall et al., 2012 - Infection-Responsive Expansion of the Hematopoietic Stem and Progenitor Cell Compartment in Zebrafish Is Dependent upon Inducible Nitric Oxide
- All Figures
- Figures for Hall et al., 2012
|
Fig. 3
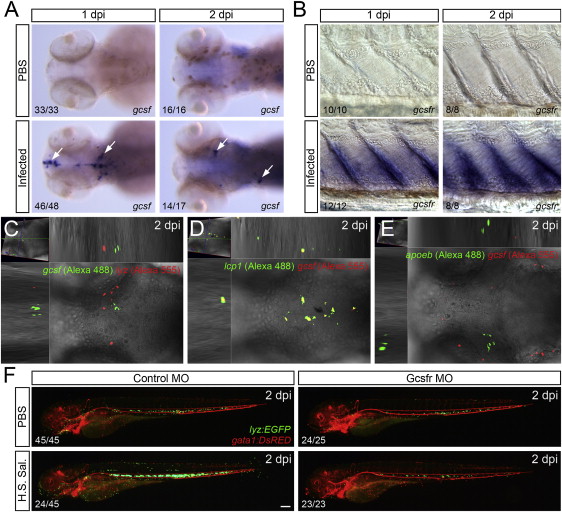
Demand-Driven Granulopoiesis Is Dependent upon Gcsf/Gcsfr Signaling (A) Expression of gcsf within the midbrain and hindbrain of infected larvae (marked by arrows), dorsal views, compared with PBS controls at 1 and 2 dpi. (B) Expression of gcsfr within the AGM of infected larvae, compared with PBS controls at 1 and 2 dpi. (C–E) Dual WMISH of gcsf and lyz, and lcp1 and apoeb, respectively, within the midbrain and hindbrain at 2 dpi following infection, with dorsal views shown. (F) Control MO- and Gcsfr MO-injected Tg(lyz:EGFP)/Tg(gata1:DsRED) larvae following injection of heat-shocked Salmonella (H.S. Sal.), compared with PBS controls at 2 dpi. Numbers represent frequency of embryos or larvae with displayed phenotype. Scale bar, 100 μm in (F). See also Figure S3.