
Fig. 2
- ID
- ZDB-IMAGE-120209-12
- Genes
- Publication
- Hall et al., 2012 - Infection-Responsive Expansion of the Hematopoietic Stem and Progenitor Cell Compartment in Zebrafish Is Dependent upon Inducible Nitric Oxide
- All Figures
- Figures for Hall et al., 2012
|
Fig. 2
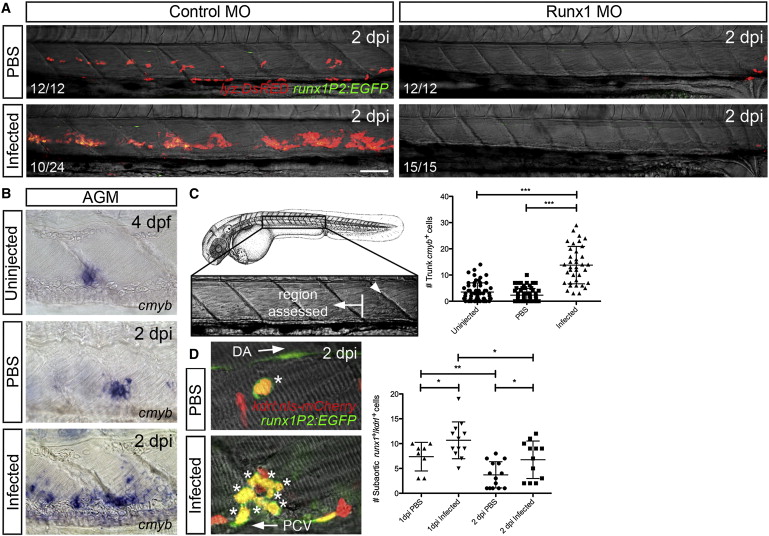
HSPC Compartment Expands in Response to Infection (A) Confocal imaging through the AGM of control MO- and Runx1 MO-injected Tg(lyz:DsRED)/Tg(runx1P2:EGFP) larvae following infection, compared with PBS controls at 2 dpi. (B) Expression of cmyb within the AGM of uninjected, PBS control and infected larvae at 2 dpi. (C) Quantification of cmyb-expressing cells within the AGM (as defined in schematic) of larvae shown in (B); arrowhead marks somite boundary that intersects cloaca. (D) Quantification of dual-labeled HSPCs (marked by asterisks) within the subaortic space of infected Tg(runx1P2:EGFP)/Tg(kdrl:nls-mCherry) larvae, compared with PBS controls at 1 and 2 dpi. All views, anterior to left. Numbers represent frequency of embryos or larvae with displayed phenotype. Scale bar, 50 μm in (A). Abbreviations: DA, dorsal aorta; PCV, posterior cardinal vein; *p < 0.05; **p < 0.01; ***p < 0.001. See also Figure S2.