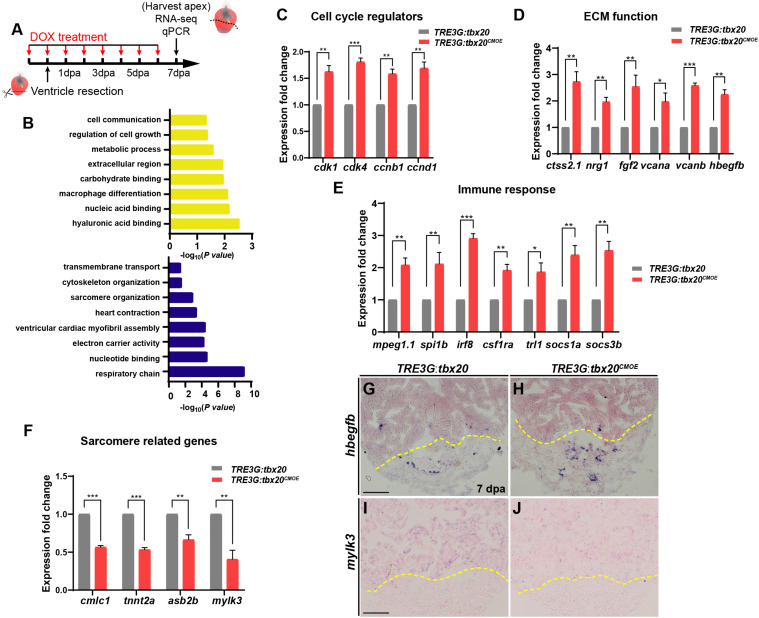
IMAGE

FIGURE 4

ID
ZDB-IMAGE-200829-77
Source
Figures for Fang et al., 2020
Image
Figure Caption

FIGURE 4

Myocardial tbx20 overexpression affects expression of various injury responsive genes following heart injury. (A) Schematic of DOX treatment, heart injury and tissue collection procedures. RNA samples were extracted from the ventricular apices (below the dashed line). For each group, 6–8 samples were collected, and three independent biological replicates were carried out. (B) Significantly enriched gene ontology (GO) analysis based on RNA-seq results revealed upregulated gene categories (upper panel), and downregulated gene categories (lower panel). (C–F) Bar graphs indicate qPCR analyses of relative expression levels of genes associated with “Cell cycle regulators” (C), “ECM function” (D), “Immune response” (E) and “Sarcomere related genes” (F) in ventricular apices from DOX-treated Tg(TRE3G:tbx20CMOE) and Tg(TRE3G:tbx20) at 7 dpa. Data represents three biological replicates. Mean ± SEM, *p < 0.05, **p < 0.01, ***p < 0.001. (G–J) Representative images of ISH analyses for hbegfb(G,H) and mylk3(I,J) on 7 dpa heart sections from Tg(TRE3G:tbx20CMOE) and Tg(TRE3G:tbx20) zebrafish with DOX treatment. Scale bar: 100 μm.

Acknowledgments
This image is the copyrighted work of the attributed author or publisher, and ZFIN has permission only to display this image to its users. Additional permissions should be obtained from the applicable author or publisher of the image. Full text @ Front Cell Dev Biol