FIGURE SUMMARY
Title

Period 2: A Regulator of Multiple Tissue-Specific Circadian Functions

Authors
Ruggiero, G., Ben-Moshe Livne, Z., Wexler, Y., Geyer, N., Vallone, D., Gothilf, Y., Foulkes, N.S.
Source
Full text @ Front. Mol. Neurosci.

Above: Establishment of a TALEN-mediated per2 KO zebrafish line. A pair of TALENs was used to target the 2nd exon of the zebrafish per2 gene (TALEN left and right target sites are highlighted in yellow). A deletion of 8 bp (red dashes against a gray background) resulted in a frameshift mutation. Below: The consequent introduction of a premature stop codon and a predicted truncated PER2 protein of 160 aa compared with the 1399 aa WT protein. PER-ARNT-SIM domains (PAS, orange) and C-terminal of PAS domain (PAC, green) in the WT protein are indicated.

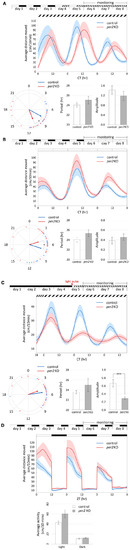
Figure 2. Per2 KO affects the phase of circadian rhythms of locomotor activity and their entrainment by light. Analysis of locomotor activity of 6–8 dpf per2 KO and control larvae under various lighting conditions. (A–D) Top, experimental design of the photic treatment prior to and throughout activity monitoring. White boxes represent light, black boxes represent dark, and diagonally lined boxes represent dim light. Middle, the average distance moved (cm/10 min) is plotted on the y-axis and circadian time (CT) for panels (A–C) or zeitgeber time (ZT) for panel (D) is plotted on the x-axis; error bars indicate SE. (A–C) Bottom from left to right, comparison of average phase, period (±SE) and amplitude (±SE) between genotypes. In the circular plot of circadian phase, arrow direction represents the average phase for each genotype and the length represents the variance (longer arrow stands for low variance and vice versa). (D) Bottom, comparison of average activity (±SE) between genotypes throughout the light and dark segments. (A) Circadian rhythms of locomotor activity under DimDim, after entrainment by 3 LD cycles and 2 light-dim light (LDim) cycles; per2 KO larvae (n = 21) display a phase delay of 2.7 h compared to control larvae (n = 20; p < 0.05 (denoted by *), Watson–Williams test). (B) Circadian rhythms of locomotor activity under LL, after entrainment by 5 LD cycles; per2 KO larvae (n = 24) display a phase advance of 2.3 h compared to control larvae (n = 22; p < 0.05 (denoted by *), Watson–Williams test). (C) Circadian rhythms of locomotor activity under DimDim, after exposure to a 3-h light pulse (indicated by red arrowhead); per2 KO larvae (n = 23) display a decreased amplitude of activity rhythmicity compared to control larvae (n = 23; p < 0.001 (denoted by ***), t-test). (D) Locomotor activity under LD cycles is not affected by per2 KO; no significant difference in average activity was observed between genotypes during both the light and the dark segments (n = 24 per2 KO; n = 23 controls).

Circadian clock gene expression analysis in per2 KO and WT larvae. (A) Schematic representation of the experimental design. The horizontal bars represent the lighting conditions before and during sampling; white and black boxes indicate light and dark periods, respectively; the arrows show the sampling times. WT and per2 mutant larvae were kept 4 dpf in LD cycle (12 h light-12 h dark) conditions. On the 5th dpf, total RNA was extracted from pools of larvae collected at 6-h intervals during a sampling window of 24 h. (B) qRT-PCR analysis of mRNA expression levels of the circadian clock genes (clock1, cry1a, and per1b) in WT and per2 mutant larvae. Mean mRNA relative expression (n = 2–3) ± SD is plotted on the y-axis, while zeitgeber time (ZT) is plotted on the x-axis. ZT0 corresponds to lights-on, ZT12 to lights-off. A significant, small decrease in expression level was observed in mutants in all three genes (***p < 0.001, ANOVA genotype effect, Table 1). Asterisks represent levels of significance in comparing the two genotypes at each time point individually, corrected by Sidak’s method (***p < 0.001, *p < 0.05).

EXPRESSION / LABELING:
Genes:
Fish:
Condition:
Anatomical Term:
Stage: Day 5
PHENOTYPE:
Fish:
Condition:
Observed In:
Stage: Day 5

Per2 knockout alters rhythmic mRNA expression of the cry1a and clock1 clock genes in adult zebrafish tissues. qRT-PCR analysis of expression levels of the circadian clock genes clock1 and cry1a in the (A) liver, (B) heart, (C) brain, (D) fin, (E) muscle, (F) gut and (G) eyes of WT and per2 mutant adult fish. Sets (n = 3) of 4 WT and per2 KO fishes (each set containing two males and two females) were maintained under LD cycle (14 h light-10 h dark) conditions, tissues were dissected and pooled for RNA extraction at 6-h intervals during a sampling window of 24 h. Mean mRNA relative expression ± SD is plotted on the y-axis; zeitgeber time (ZT) is plotted on the x-axis. Zeitgeber times are indicated for each sample. ZT0 corresponds to lights-on, ZT14 to lights-off. A change in rhythm was observed for both genes in liver, heart, fin, muscle, gut, and eyes, as determined by a significant ANOVA Genotype × Time interaction effect (p < 0.001, see Table 1). For both genes, no effect was observed in the brain. Asterisks represent levels of significance in comparing the two genotypes at each time point individually, corrected by Sidak’s method (***p < 0.001, **p < 0.01, *p < 0.05).

EXPRESSION / LABELING:
Genes:
Fish:
Condition:
Anatomical Terms:
Stage: Adult
PHENOTYPE:
Fish:
Condition:
Observed In:
Stage: Adult

Per2 knockout alters the rhythmic mRNA expression of clock-controlled genes in the adult zebrafish heart. qRT-PCR analysis of expression levels of four putative CCGs (A)timp3, (B)mef2a, (C)cox6a2, and (D)smad3a in WT and per2 KO heart tissues. Sets (n = 3) of 4 WT and per2 KO fish (each set containing two males and two females) were maintained under LD cycle (14 h light-10 h dark) conditions, hearts were dissected and pooled for RNA extraction at 6-h intervals during a sampling window of 24 h. Mean mRNA relative expression ± SD is plotted on the y-axis; zeitgeber time (ZT) is plotted on the x-axis. Zeitgeber times are indicated for each sample. ZT0 corresponds to lights-on, ZT14 to lights-off. A change in rhythm was observed for timp3, cox6a2, mef2a, and smad3a, as determined by a significant ANOVA Genotype × Time interaction effect for all genes (p < 0.01, see Table 1). Asterisks represent levels of significance in comparing the two genotypes at each time point individually, corrected by Sidak’s method (***p < 0.001, *p < 0.05).

EXPRESSION / LABELING:
Genes:
Fish:
Condition:
Anatomical Term:
Stage: Adult
PHENOTYPE:
Fish:
Condition:
Observed In:
Stage: Adult

Per2 knockout alters the rhythmic mRNA expression of regulators of key physiological hepatic processes in the adult zebrafish liver. qRT-PCR analysis of expression levels of four CCGs (A)impdh2, (B)hnf1a, (C)cyp1a, and (D)ppargc1b in WT and per2 KO liver. Sets of 4 WT and per2 KO fishes (each set containing two males and two females) were maintained under LD cycle (14 h light-10 h dark) conditions, livers were dissected and pooled for RNA extraction at 6-h intervals during a sampling window of 24 h. Mean mRNA relative expression (n = 2–3) ± SD is plotted on the y-axis; zeitgeber time (ZT) is plotted on the x-axis. Zeitgeber times are indicated for each sample. ZT0 corresponds to lights-on, ZT14 to lights-off. A change in rhythm was observed for impdh2, hnf1a, cyp1a and ppargc1b, as determined by a significant ANOVA Genotype × Time interaction effect for all genes (p < 0.01, see Table 1). Furthermore, hnf1a exhibited a 12 h phase delay, and ppargc1b exhibited a 6 h phase delay. Asterisks represent levels of significance in comparing the two genotypes at each time point individually, corrected by Sidak’s method (***p < 0.001, **p < 0.01, *p < 0.05).

EXPRESSION / LABELING:
Genes:
Fish:
Condition:
Anatomical Term:
Stage: Adult
PHENOTYPE:
Fish:
Condition:
Observed In:
Stage: Adult

Per2 knockout alters the rhythmic mRNA expression of CCGs encoding key enzymes in non-essential amino acid synthesis in the adult zebrafish liver. qRT-PCR analysis of expression levels of six CCGs (A)glu1a, (B)asns, (C)gpt2l(D)glud1b(E)got1, and (F)got2a in WT and per2 KO liver tissues as described in the legend for Figure 6. A change in rhythm was observed for all genes, as determined by a significant ANOVA Genotype × Time interaction effect for all genes (p < 0.001, see Table 1). Asterisks represent levels of significance in comparing the two genotypes at each time point individually, corrected by Sidak’s method (***p < 0.001, **p < 0.01, *p < 0.05).

EXPRESSION / LABELING:
Genes:
Fish:
Condition:
Anatomical Term:
Stage: Adult
PHENOTYPE:
Fish:
Condition:
Observed In:
Stage: Adult

Per2 knockout alters the rhythmic mRNA expression of CCGs in adult zebrafish skeletal muscle. qRT-PCR analysis of expression levels of the CCGs (A)hsf2 and (B)myf6 in WT and per2 KO skeletal muscle. Sets of 4 WT and per2 KO fish (each set containing two males and two females) were maintained under LD cycle (14 h light-10 h dark) conditions, muscle tissue was dissected and pooled for RNA extraction at 6-h intervals during a sampling window of 24 h. Mean mRNA relative expression (n = 2–3) ± SD is plotted on the y-axis; zeitgeber time (ZT) is plotted on the x-axis. Zeitgeber times are indicated for each sample. ZT0 corresponds to lights-on, ZT14 to lights-off. A change in rhythm was observed for both CCGs, as determined by a significant ANOVA Genotype × Time interaction effect for all genes (p < 0.001, see Table 1). myf6 exhibited a 6 h phase delay. Asterisks represent levels of significance in comparing the two genotypes at each time point individually, corrected by Sidak’s method (***p < 0.001).

EXPRESSION / LABELING:
Genes:
Fish:
Condition:
Anatomical Term:
Stage: Adult
PHENOTYPE:
Fish:
Condition:
Observed In:
Stage: Adult

Per2 knockout alters the rhythmic mRNA expression of cell cycle regulator genes in adult zebrafish fin tissues. qRT-PCR analysis of expression levels of some cell cycle CCGs (A)cyclin A2, (B)cyclin B1, and (C)p21 in WT and per2 KO fin tissue. Sets of 4 WT and per2 KO fishes (each set containing two males and two females) were maintained under LD cycle (14 h light-10 h dark) conditions, a portion of caudal fin tissue was amputated and pooled for RNA extraction at 6-h intervals during a sampling window of 24 h. Mean mRNA relative expression (n = 2–3) ± SD is plotted on the y-axis; zeitgeber time (ZT) is plotted on the x-axis. Zeitgeber times are indicated for each sample. ZT0 corresponds to lights-on, ZT14 to lights-off. A change in rhythm was observed for cyclin A2, cyclin B1, and p21, as determined by a significant ANOVA Genotype × Time interaction effect for all genes (p < 0.001, see Table 1). Asterisks represent levels of significance in comparing the two genotypes at each time point individually, corrected by Sidak’s method (***p < 0.001).

EXPRESSION / LABELING:
Genes:
Fish:
Condition:
Anatomical Term:
Stage: Adult
PHENOTYPE:
Fish:
Condition:
Observed In:
Stage: Adult

Western blot analysis and quantification of the phospho-H3 protein in fins of the WT and per2 KO zebrafish line. (A) Schematic representation of the experimental design. (B) Quantification of Western blot analysis of Phospho-Histone H3 (p-H3) ser10 expression level normalized to using Histone H3 (H3) as loading control. Relative optical density values for pH3-specific bands were calculated from measurements of ECL images and plotted on the y-axis. (C) Representative images of western blots obtained with pH3 and H3 specific antibodies used for the quantification in panel (B). Asterisks represent levels of significance in comparing the two genotypes at each timepoint individually, corrected by Sidak’s method (*p < 0.05).

Acknowledgments
This image is the copyrighted work of the attributed author or publisher, and ZFIN has permission only to display this image to its users. Additional permissions should be obtained from the applicable author or publisher of the image. Full text @ Front. Mol. Neurosci.