
- Title
-
LSD1/KDM1A promotes hematopoietic commitment of hemangioblasts through downregulation of Etv2
- Authors
- Takeuchi, M., Fuse, Y., Watanabe, M., Andrea, C.S., Takeuchi, M., Nakajima, H., Ohashi, K., Kaneko, H., Kobayashi-Osaki, M., Yamamoto, M., Kobayashi, M.
- Source
- Full text @ Proc. Natl. Acad. Sci. USA
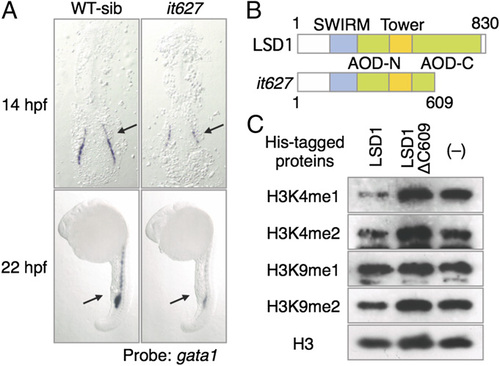
Isolation of LSD1 mutant. (A) Expression of gata1 in WT sibling (WT-sib) and it627 embryos. The arrows indicate hematopoietic tissues: posterior LPM (14 hpf) and ICM (22 hpf). (B) Structures of the LSD1 proteins. SWIRM, Swi3p, Rsc8p, and Moira domain; Tower, tower domain. (C) Results of the demethylation assay using bacterially expressed LSD1 proteins and bulk histones from calf thymus as substrates. Methylated proteins were detected by immunoblotting using specific antibodies. EXPRESSION / LABELING:
PHENOTYPE:
|
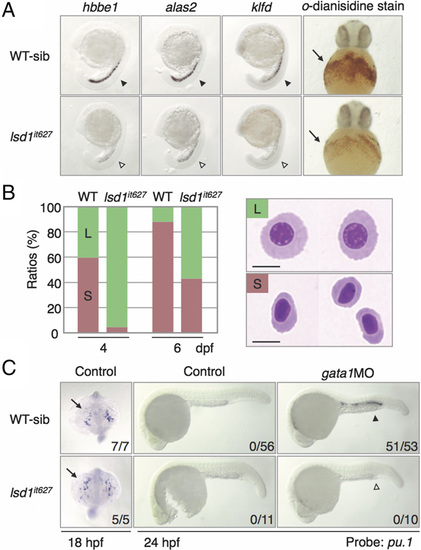
Hematopoietic defects in lsd1it627 embryos. (A) Expression of the Gata1 downstream genes at 20 hpf (arrowheads) and o-dianisidine staining in the blood islands at 36 hpf (arrows). The same expression profile was seen in both WT and heterozygous mutants (WT-sib), although expression in homozygous mutants (lsd1it627) was markedly diminished. hbbe1, hemoglobin beta embryonic 1; klfd, krüppel-like transcription factor d. (B) Wright–Giemsa staining of cytospin preparations of circulating blood cells. Green (L) and red (S) bars indicate large immature erythroblasts and small mature erythrocytes, respectively. (Scale bars, 5 µm.) (C) Expression of pu.1 at 18 hpf (anterior-dorsal views) or 24 hpf (lateral views) in WT or lsd1it627 embryos injected or not injected with 0.5 pmol of gata1MO. The arrows and arrowheads denote the anterior LPM and ICM, respectively. Numbers indicate the percentage of embryos exhibiting strong expression of indicated genes. The ectopic pu.1 expression in the ICM (closed arrowhead) induced by gata1MO injection was down-regulated in lsd1it627 embryos (open arrowhead). EXPRESSION / LABELING:
PHENOTYPE:
|
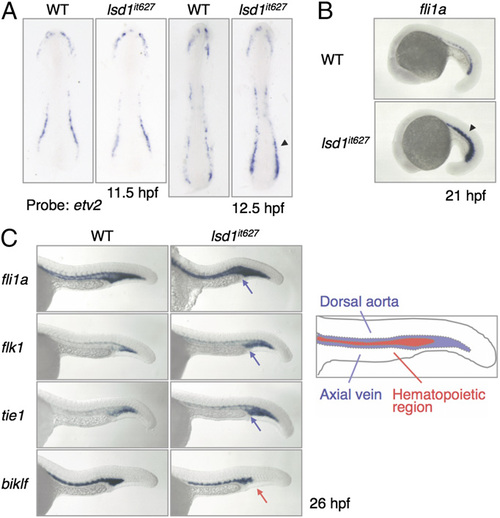
Up-regulation of endothelial markers in lsd1it627 embryos. (A) Expression of etv2 at the indicated developmental stages in WT or lsd1it627 embryos. The arrowhead indicates the up-regulation of etv2 in the posterior LPM. (B) Expression of fli1a at 21 hpf in WT or lsd1it627 embryos. The arrowhead indicates the up-regulation of fli1a in the ICM. (C) Expression of fli1a, flk1, tie1, and biklf at 26 hpf in the trunk region. The blue and red arrows indicate up-regulation of endothelial markers and down-regulation of a hematopoietic marker, respectively, in the hematopoietic region. (Right) Diagram of the hematopoietic and endothelial regions in WT embryos. EXPRESSION / LABELING:
PHENOTYPE:
|

Rescue of the hematopoietic defects in lsd1it627 embryos by etv2 knockdown. (A) Expression of gata1 in WT or lsd1it627 embryos injected or not injected with 0.5 pmol of the indicated morpholino oligonucleotides. The down-regulation of gata1 in lsd1it627 embryos (open arrowheads) was rescued by the etv2MO injection (closed arrowheads). 5mis, 5-mismatch. (B) Expression of pu.1 at 24 hpf in WT or lsd1it627 embryos injected or not injected with 0.5 pmol of the indicated morpholino oligonucleotides. The gata1MO-induced ectopic pu.1 expression in the ICM (arrows) was lost in lsd1it627 embryos (open arrowhead) and recovered by the coinjection of etv2MO (closed arrowhead). (C) Methylation status of histone H3-K4 on the etv2 gene in 15-hpf embryos injected (gray bars) or not injected (white bars) with 1 pmol of lsd1MO (lsd1MO inj). Genomic regions (up1, int2, 35bp, ex8) examined by ChIP are shown as black bars. The results are means ± SEs of three independent experiments. *P < 0.05; Student’s t test.> EXPRESSION / LABELING:
PHENOTYPE:
|
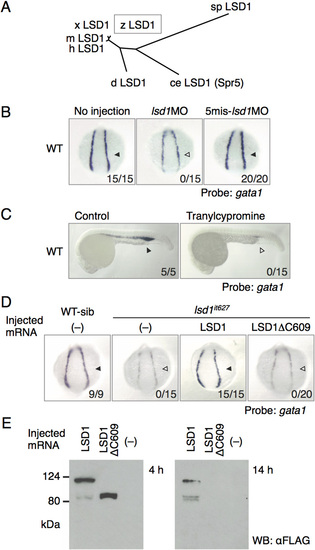
Identification of LSD1 as a responsive gene for the it627 mutant. (A) Phylogenetic tree constructed by the neighbor-joining method for the full-length amino acid sequences of LSD1 proteins. ce, Caenorhabditis elegans; d, Drosophila melanogaster; h, human; m, mouse; sp, Schizosaccharomyces pombe; x, Xenopus laevis; z, zebrafish. (B) Expression of gata1 in the LPM at 14 hpf in WT embryos injected or not injected with 1 pmol of the indicated morpholino oligonucleotides. Arrowheads denote gata1 expression. Numbers indicate the percentage of embryos exhibiting strong gata1 expression. 5mis, 5-mismatch. (C) Effects of tranylcypromine on gata1 expression. The embryos were treated with 300 µM tranylcypromine in WT embryos from 12 hpf or earlier to 24 hpf. (D) Expression of gata1 at 14 hpf in WT or lsd1it627 embryos injected with or without mRNA encoding the indicated LSD1 proteins. WT-sib indicates WT or heterozygous mutants, and lsd1it627 designates homozygous mutants. (E) Expression and stability of overexpressed WT LSD1 and LSD1ΔC609 proteins in 4-hpf and 14-hpf embryos were examined by immunoblotting using anti-FLAG antibody. WB, Western blot. |
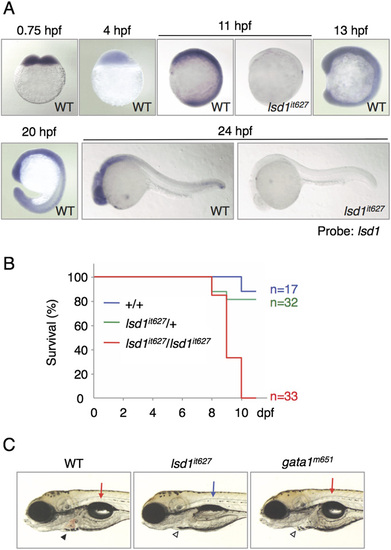
Nonhematopoietic defects in lsd1it627 embryos. (A) Expression of lsd1 at the indicated developmental stages was analyzed in WT or lsd1it627 embryos. Ubiquitous expression of lsd1 in zebrafish embryos was impaired in lsd1it627 mutants. (B) Survival rates of lsd1it627 mutants calculated using the Kaplan–Meier method. (C) Results of a comparison of the phenotypes between lsd1it627 and gata1m651 mutants at 4 dpf. The arrows and arrowheads indicate the swim bladder and erythrocytes in the heart, respectively. The presence of pale erythrocytes due to erythropoietic defects was detected in both lsd1it627 and gata1m651 mutants, whereas defects in the swim bladder were only observed in lsd1it627 mutants. PHENOTYPE:
|
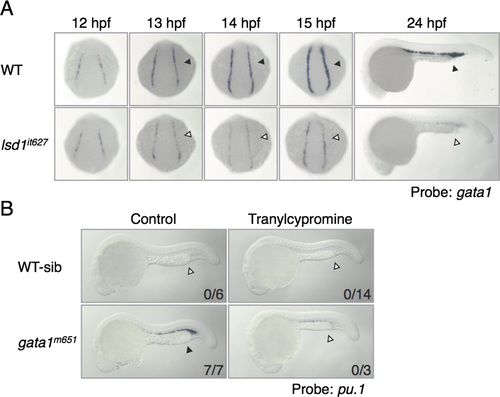
Defects in the expression of hematopoietic markers by lsd1 down-regulation. (A) Defects in gata1 up-regulation in lsd1it627 embryos. The gata1 expression at the indicated developmental stages (arrowheads) was analyzed in WT or lsd1it627 embryos. (B) Effects of tranylcypromine on ectopic pu.1 expression in gata1m651 mutants. The embryos were treated with 300 µM tranylcypromine from 12 to 24 hpf. Arrowheads indicate ectopic pu.1 expression. |
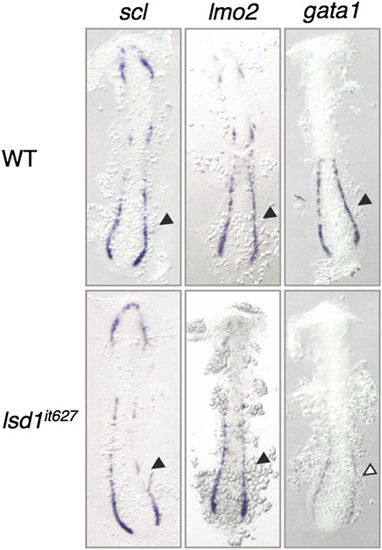
Expression of scl and lmo2 in lsd1it627 embryos. The expression of scl, lmo2, and gata1 at 15 hpf in WT or lsd1it627 embryos is shown. Arrowheads indicate the posterior LPM. |
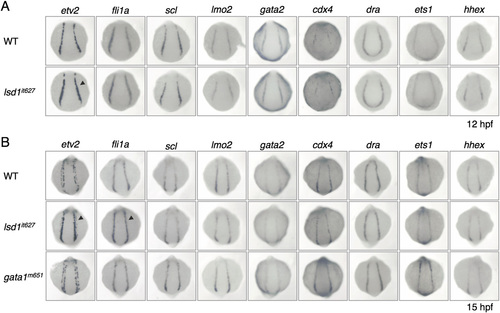
Expression of hemangioblast markers in lsd1it627 embryos. The expression of the indicated hemangioblast markers at 12 hpf (A) and 15 hpf (B) in WT, lsd1it627, or gata1m651 embryos is shown. The arrowheads indicate up-regulation of etv2 and fli1a in the posterior LPM of lsd1it627 embryos. cdx4, caudal type homeobox 4; dra, draculin; ets1, E26 transformation-specific 1; hhex, hematopoietically expressed homeobox. |
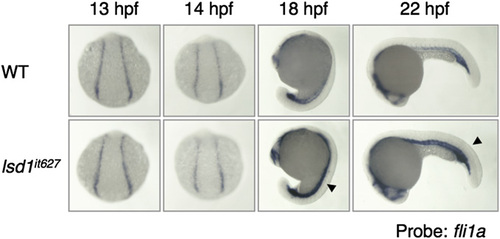
Expression of fli1a in lsd1it627 embryos. The expression of fli1a at the indicated developmental stages in WT or lsd1it627 embryos is shown. It is noted that no difference was observed between WT and lsd1it627 embryos before 15 hpf. The arrowheads indicate the up-regulation of fli1a in the ICM of lsd1it627 embryos. |
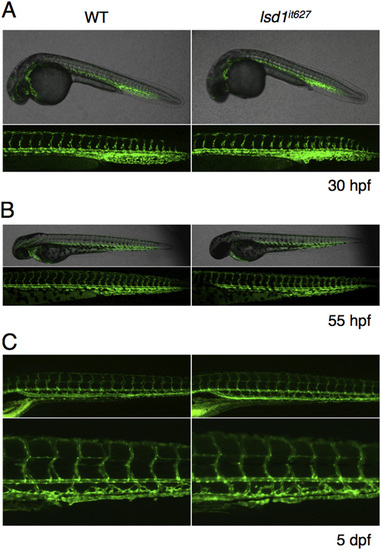
Effects of the lsd1 mutation on angiogenesis and vascular morphogenesis. Confocal images of Tg(kdrl:EGFP)s843 transgenic WT or lsd1it627 embryos at 30 hpf (A) and 55 hpf (B). (C) Fluorescent images of Tg(kdrl:EGFP)s843 transgenic WT or lsd1it627 embryos at 5 dpf. |
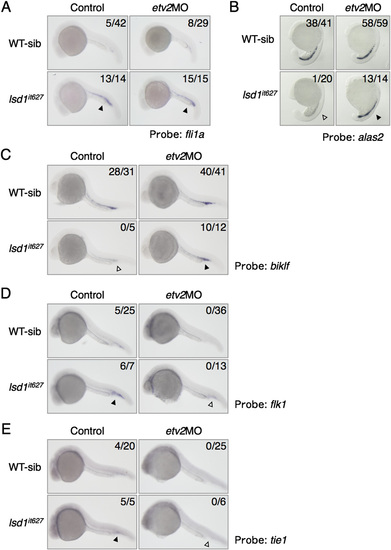
Expression of hematopoietic and endothelial cell markers in etv2 knockdown lsd1it627 embryos. The expression of fli1a (A), alas2 (B), biklf (C), flk1 (D), and tie1 (E) in WT or lsd1it627 embryos injected or not injected with 0.5 pmol of etv2MO is shown. The down-regulation of alas2 and biklf in lsd1it627 embryos (white arrowheads) was rescued by the etv2MO injection (black arrowheads). The up-regulation of flk1 and tie1, but not fli1a, in lsd1it627 embryos was rescued by the etv2MO injection (arrowheads). |

Unillustrated author statements PHENOTYPE:
|