
|
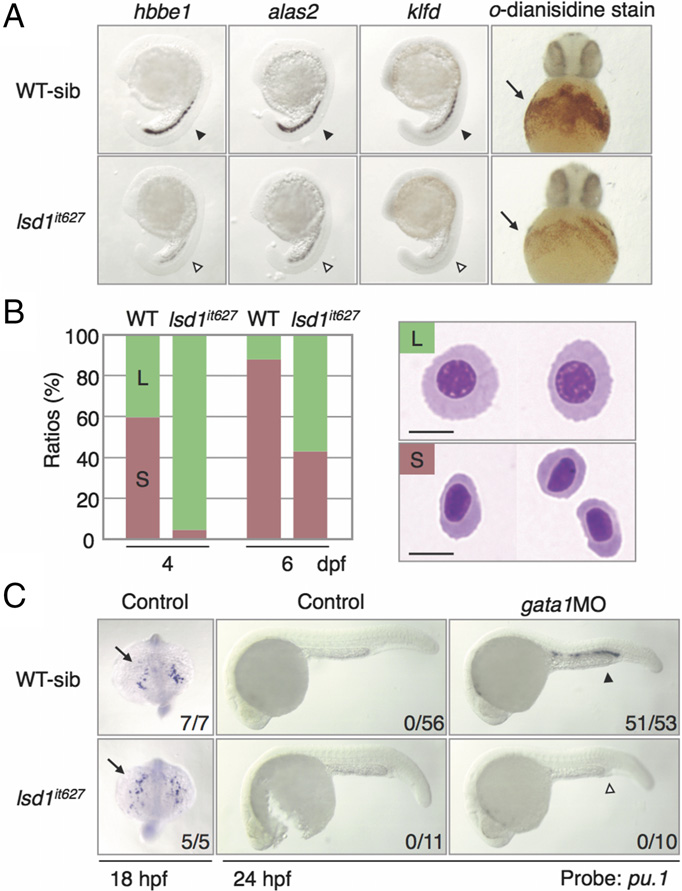
Fig. 2
Hematopoietic defects in lsd1it627 embryos. (A) Expression of the Gata1 downstream genes at 20 hpf (arrowheads) and o-dianisidine staining in the blood islands at 36 hpf (arrows). The same expression profile was seen in both WT and heterozygous mutants (WT-sib), although expression in homozygous mutants (lsd1it627) was markedly diminished. hbbe1, hemoglobin beta embryonic 1; klfd, krüppel-like transcription factor d. (B) Wright–Giemsa staining of cytospin preparations of circulating blood cells. Green (L) and red (S) bars indicate large immature erythroblasts and small mature erythrocytes, respectively. (Scale bars, 5 µm.) (C) Expression of pu.1 at 18 hpf (anterior-dorsal views) or 24 hpf (lateral views) in WT or lsd1it627 embryos injected or not injected with 0.5 pmol of gata1MO. The arrows and arrowheads denote the anterior LPM and ICM, respectively. Numbers indicate the percentage of embryos exhibiting strong expression of indicated genes. The ectopic pu.1 expression in the ICM (closed arrowhead) induced by gata1MO injection was down-regulated in lsd1it627 embryos (open arrowhead).