
- Title
-
Ribosomal biogenesis genes play an essential and p53-independent role in zebrafish pancreas development
- Authors
- Provost, E., Wehner, K.A., Zhong, X., Ashar, F., Nguyen, E., Green, R., Parsons, M.J., and Leach, S.D.
- Source
- Full text @ Development
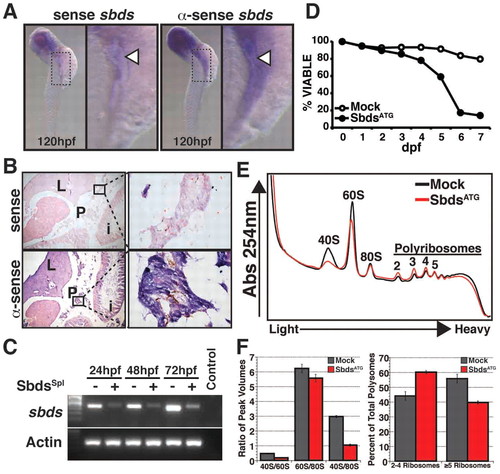
Zebrafish sbds is an essential developmental gene with high-level expression in pancreas and surrounding tissues. (A) Expression of sbds examined by in situ hybridization in wild-type zebrafish embryos at 120 hpf. The boxed pancreatic region is shown at higher magnification to illustrate pancreatic and peri-pancreatic expression (arrowheads) of sbds. (B) Adult zebrafish pancreas (boxed) expresses sbds. (C) SbdsSpl MO results in durable loss of sbds transcript as assessed by RT-PCR. (D) Survival curve for recipients of SbdsATG MO illustrates near complete embryonic lethality by 7 dpf, as compared with mock injected embryos. (E) Ribosome profile of lysate prepared from 48-hpf control and SbdsATG MO-injected embryos. (F) Quantification of ribosomal subunit ratios, monosomes and polysomes in control and SbdsATG MO-injected embryos. Error bars indicate mean ± s.e.m. i, intestine; L, liver; P, pancreas. |
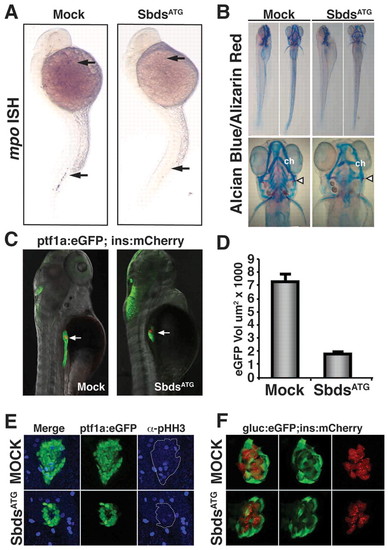
sbds knockdown in zebrafish embryos recapitulates human SDS organogenesis phenotypes. (A) At 24 hpf, loss of neutrophils in SbdsATG MO-injected embryos is revealed by in situ hybridization for the neutrophil marker mpo. mpo-positive cells were absent from both the anterior lateral mesoderm and the intermediate cell mass (top and bottom arrows, respectively). (B) At 120 hpf, abnormal cartilage of the gill arches and cerotohyal (ch) cartilage and bone (arrowheads) were observed in SbdsATG MO-injected embryos. (C) Visualization of ptf1-expressing pancreatic progenitor cells and differentiated beta cells in 72-hpf ptf1a:eGFP;ins:mCherry embryos (arrows). SbdsATG MO-injected embryos showed defects in ptf1-expressing pancreatic progenitors (green), whereas beta cells in the principal islet appeared normal (red). (D) Quantification of the volume of ptf1a:eGFP-expressing cells reveals an almost 75% reduction of pancreatic volume in SbdsATG MO-injected embryos. Error bars indicate s.e.m. (E) Immunofluorescence of phospho-histone H3 (pHH3, blue) marks proliferation in the exocrine pancreatic mass. Proliferation was decreased in the SbdsATG MO-injected embryos at 72 hpf. (F) High-resolution images of the pancreatic islet using gcga:eGFPia1;ins:mCherry double-transgenic zebrafish reveal normal islet architecture with peripheral alpha cells (green) and central beta cells (red) in SbdsATG MO-injected embryos at 72 hpf. EXPRESSION / LABELING:
PHENOTYPE:
|

Loss of p53 does not rescue sbds organogenesis defects. (A) The body curvature observed in SbdsATG MO-injected zebrafish embryos is attenuated in SbdsATG/p53ATG MO-injected embryos at 48 hpf. (B) The p53 transcriptional targets Δ113p53 and p21 are induced upon injection of SbdsATG MO, as assessed by semi-quantitative PCR; co-injection of p53ATG MO abrogates this response. Error bars indicate s.e.m. (C) The 72-hpf pancreatic progenitor phenotype induced by the SbdsATG MO is not rescued by co-injection of p53ATG MO (arrows). (D) The absence of mpo-expressing neutrophils in the intermediate cell mass of SbdsATG/p53ATG MO-injected embryos was detected at 24 hpf (arrowheads). (E) Co-injection of p53Spl MO and SbdsATG MO into ptf1a:eGFP;ins:mCherry embryos does not rescue the defective expansion of pancreatic progenitor cells (arrows). (F) Genetic loss of p53 in p53zdf1/zdf1 embryos does not rescue the SbdsATG MO-induced neutrophil phenotype, as assessed by in situ hybridization for mpo at 24 hpf (arrowheads). (G) The SbdsATG MO-induced pancreatic progenitor defect is not rescued in p53zdf1/zdf1;ptf1a:eGFP;ins:mCherry embryos at 72 hpf. EXPRESSION / LABELING:
PHENOTYPE:
|
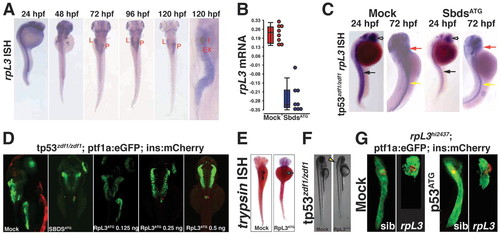
Knockdown of rpl3 phenocopies SbdsATG MO-induced defects in pancreas development. (A) Expression of rpl3 is widespread at 24 hpf and becomes progressively restricted to the endoderm, with high-level pancreatic expression at 120 hpf. The principal islet (I) is labeled by in situ hybridization for insulin (red). (B) rpl3 expression is decreased in SbdsATG MO-injected embryos, as quantified by microarray analysis of transcript abundance. Error bars indicate s.e.m. (C) In situ hybridization for rpl3 in SbdsATG MO-injected p53zdf1/zdf1 embryos confirms loss of rpl3 expression in somites (black arrows), central nervous system (white arrows), pharyngeal arches (red arrows) and intestine (yellow arrows) of developing embryos. (D) An MO dose-dependent defect in pancreas progenitor expansion was observed in Rpl3ATG MO-injected ptf1a:eGFP;ins:mCherry;p53zdf1/zdf1 embryos. (E) The small pancreas (arrow) of p53zdf1/zdf1 embryos injected with 0.5 ng Rpl3ATG MO is positive for trypsin expression by in situ hybridization. (F) p53zdf1/zdf1 embryos injected with 0.5 ng Rpl3ATG MO at 72 hpf exhibit small heads and hydroencephaly (yellow arrowhead). (G) rpl3hi2437/+;ptf1a:eGFP;ins:mCherry heterozygotes bearing a mutagenic rpl3 transgenic insertion were incrossed. rpl3hi2437/hi2437 homozygous embryos displayed disrupted pancreas progenitor expansion at 72 hpf. Injection of rpl3hi2437;ptf1a:eGFP;ins:mCherry with the p53ATG MO did not rescue the pancreatic progenitor phenotype of homozygous rpl3hi2437hi/2437 embryos. L, liver; P, pancreas; I, islet; Ex, exocrine pancreas. EXPRESSION / LABELING:
PHENOTYPE:
|

The pes mutant phenocopies SbdsATG MO-induced p53-independent defects in pancreas development. (A) In situ hybridization at 24 hpf demonstrates pes expression in the eye and central nervous system. At 72 hpf, pes expression is detected in endoderm, including the developing pancreas. (B) The peshi2Tg/hi2Tg phenotype includes axis defects (tail curvature), a small dark head and a small eye. (C) Semi-quantitative RT-PCR of peshi2Tg/hi2Tg embryos reveals activation of the p53 target genes Δ113p53 (24-fold, P<0.0001) and p21 (2.4-fold, P<0.01). Error bars indicate s.e.m. (D) Loss of p53 does not rescue axis defects in peshi2Tg/hi2Tg embryos. Representative images of siblings (sib) generated either from a peshi2Tg/WT incross and injected with or without (Mock) p53ATG MO or p53Spl MO, or from a peshi2Tg/WT;p53zdf1/zdf1 incross. Asterisks indicate siblings displaying the pes phenotype. See supplementary material Fig. S6 for quantification. (E) peshi2Tg/hi2Tg embryos exhibit a p53-independent defect in expansion of ptf1-expressing pancreatic progenitor cells. The pancreatic progenitor defect in 72-hpf peshi2Tg/hi2Tg;ptf1a:eGFP;ins:mCherry embryos is not rescued by p53 MO-mediated knockdown, nor by genetic inactivation of p53 as assessed by incross of peshi2Tg/WT;p53zdf1/zdf1;ptf1a:eGFP;ins:mCherry fish. EXPRESSION / LABELING:
PHENOTYPE:
|
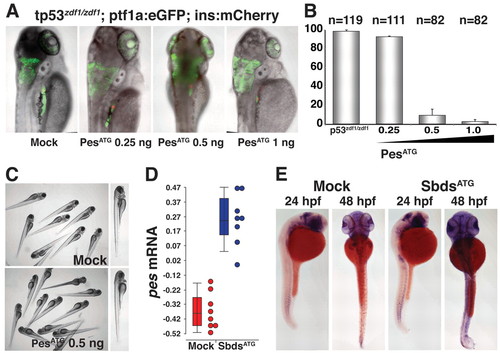
MO knockdown of pes phenocopies SbdsATG MO-induced p53-independent defects in pancreas development. (A) Injection of PesATG MO into p53zdf1/zdf1 embryos results in a dose-dependent defect in pancreatic progenitor expansion, as assessed in 72-hpf ptf1a:eGFP;ins:mCherry embryos. (B) Quantification of three independent experiments scored for the percentage of embryos with wild-type pancreas following injection of PesATG MO into a p53zdf1/zdf1;ptf1a:eGFPjh1;ins:mCherryjh2 background. (C) The gross appearance of PesATG MO-injected embryos at 72 hpf includes a small head and eye but normal body axis. (D) Microarray quantification of pes transcript levels indicates an increase in pes expression in SbdsATG MO-injected p53zdf1/zdf1 embryos. (E) Increased abundance of pes transcripts in SbdsATG MO-injected p53zdf1/zdf1 embryos is confirmed by in situ hybridization. Error bars indicate s.e.m. EXPRESSION / LABELING:
PHENOTYPE:
|
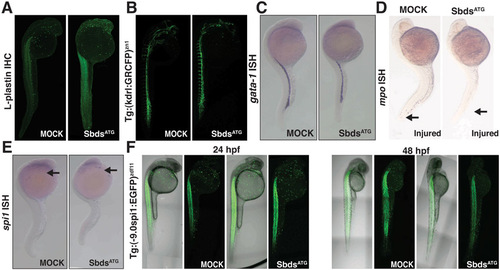
Further characterization of the hematopoietic defects in SbdsATG MO-injected embryos. (A) Immunofluorescence for L-plastin identifies macrophages at 24 hpf in both SbdsATG MO-injected and control embryos. (B) Normal development of vasculature in both SbdsATG MO-injected and control embryos as demonstrated by Tg(kdrl:GRCFP)zn1 transgene. (C) In situ hybridization for gata1, a marker of erythroid progenitors, is identical in control and SbdsATG MO-injected embryos at 24 hpf. (D) Epithelial injury does not recruit neutrophils in SbdsATG MO-injected embryos. Tails were wounded (arrow) at 24 hpf, and neutrophils were visualized at 30 hpf by in situ hybridization for mpo. (E) In situ hybridization for spi1, a marker of common neutrophil/macrophage progenitors, is identical in control and SbdsATG-MO embryos at 24 hpf (arrows). (F) Expression of Tg 9.0 spi1:eGFP at 24 hpf and 48 hpf shows no change in the number or localization of neutrophil/macrophage progenitor markers in SbdsATG MO-injected embryos. Note that expression of eGFP in the muscle is not related to hematopoietic development. |
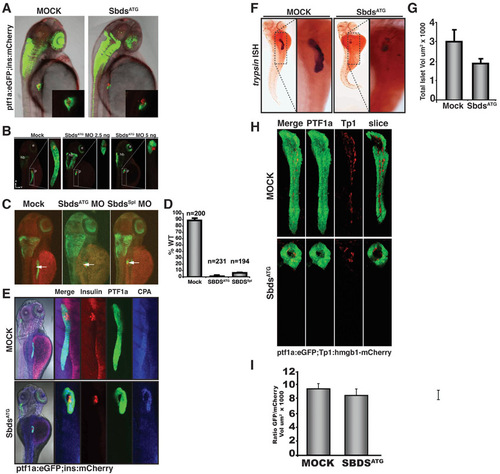
Further characterization of the pancreatic phenotype in SbdsATG MO-injected embryos. (A) At 48 hpf, both control and SbdsATG MO-injected ptf1a:eGFP;ins:mCherry embryos appear similar. Pancreatic progenitor cells have been correctly specified and ptf1a:eGFP-positive cells have migrated to achieve contact with the principal islet (red). (B) The SbdsATG MO disrupts pancreas development in a dose-dependent manner. Ptf1a:eGFP;ins:mCherry embryos were imaged at 72 hpf revealing a dose-dependent reduction in pancreatic volume (green). (C) Similar to the SbdsATG MO, a splice-blocking SbdsSpl MO also disrupts pancreatic progenitor expansion (green). (D) Quantification of the pancreatic progenitor phenotype in SbdsATG MO- and SbdsSpl MO-injected embryos, assessed at 72 hpf in three independent experiments. (E) Residual pancreatic cells in ptf1a:eGFP;ins:mCherry embryos injected with SbdsATG MO express carboxypeptidase (CPA) as detected by immunofluorescence (blue). (F) Residual pancreatic cells in SbdsATG MO-injected embryos are positive for trypsin expression by in situ hybridization. (G) Quantification of total islet volume in control and SbdsATG MO-injected embryos at 72 hpf (P=0.07). (H) The relative number of Notch-responsive progenitor cells in the developing pancreas is not affected by SbdsATG MO injection. Notch activity, as assessed by the transgenic Notch reporter line Tp1:hmgb1-mCherry, is ongoing in SbdsATG MO-injected embryos at 72 hpf. (I) Quantification of the ratio of GFP/mCherry volumes in control and SbdsATG MO-injected embryos. |
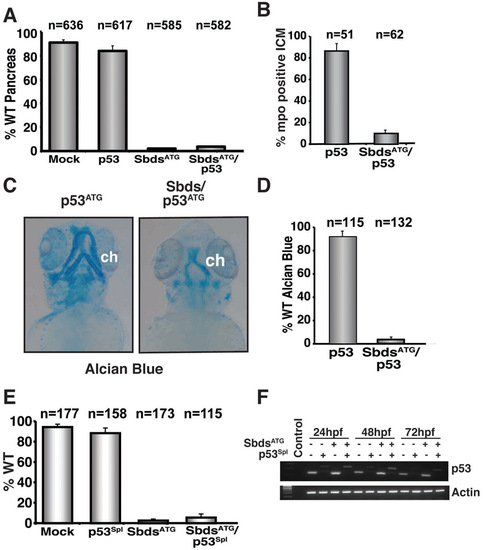
Quantification of the SbdsATG morphant phenotype with concomitant knockdown of p53. (A) Quantification of multiple independent experiments scored for wild-type pancreatic development at 72 hpf in p53ATG MO-injected embryos. (B) Quantification of three independent experiments scored for mpo-positive cells in the intermediate cell mass (ICM) at 24 hpf. (C) Disrupted cartilage persists in p53ATG/SbdsATG MO-injected embryos at 72 hpf (blue). (D) Quantification of three independent experiments scored for percentage of embryos exhibiting wild-type ceratohyal development at 72 hpf. (E) Quantification of three independent experiments scored for the fraction of embryos with wild-type pancreas in SbdsATG and p53Spl MO-injected ptf1a:eGFP;ins:mCherry embryos at 72 hpf. (F) Injection of the p53Spl MO causes an 89 bp shift and destabilization in p53 mRNA. ch, cerotohyal cartilage. |