
|
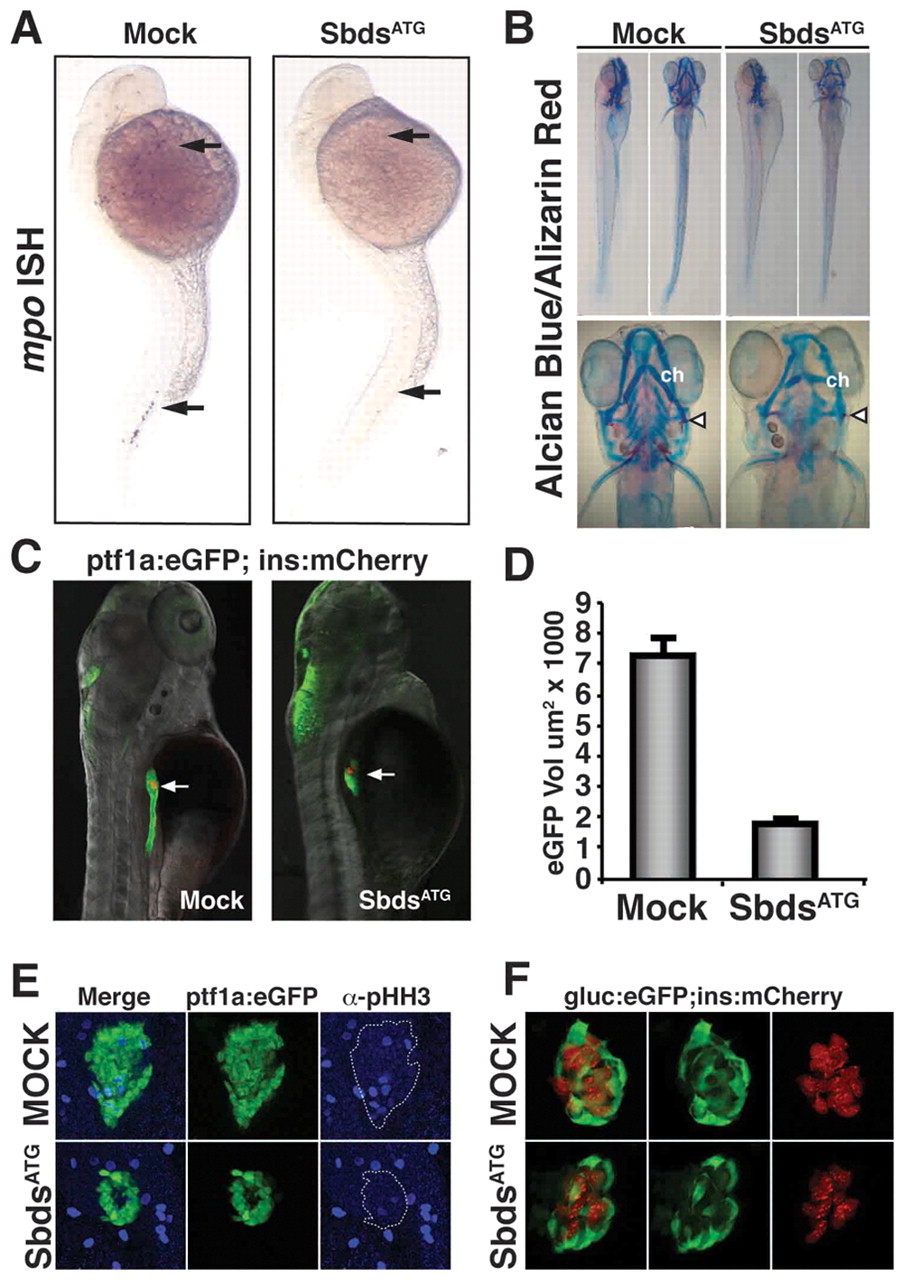
Fig. 2 sbds knockdown in zebrafish embryos recapitulates human SDS organogenesis phenotypes. (A) At 24 hpf, loss of neutrophils in SbdsATG MO-injected embryos is revealed by in situ hybridization for the neutrophil marker mpo. mpo-positive cells were absent from both the anterior lateral mesoderm and the intermediate cell mass (top and bottom arrows, respectively). (B) At 120 hpf, abnormal cartilage of the gill arches and cerotohyal (ch) cartilage and bone (arrowheads) were observed in SbdsATG MO-injected embryos. (C) Visualization of ptf1-expressing pancreatic progenitor cells and differentiated beta cells in 72-hpf ptf1a:eGFP;ins:mCherry embryos (arrows). SbdsATG MO-injected embryos showed defects in ptf1-expressing pancreatic progenitors (green), whereas beta cells in the principal islet appeared normal (red). (D) Quantification of the volume of ptf1a:eGFP-expressing cells reveals an almost 75% reduction of pancreatic volume in SbdsATG MO-injected embryos. Error bars indicate s.e.m. (E) Immunofluorescence of phospho-histone H3 (pHH3, blue) marks proliferation in the exocrine pancreatic mass. Proliferation was decreased in the SbdsATG MO-injected embryos at 72 hpf. (F) High-resolution images of the pancreatic islet using gcga:eGFPia1;ins:mCherry double-transgenic zebrafish reveal normal islet architecture with peripheral alpha cells (green) and central beta cells (red) in SbdsATG MO-injected embryos at 72 hpf.