
- Title
-
Zebrafish cdh23 Affects Rod Cell Phototransduction Through Regulating Ca2+ Transport and MAPK Signaling Pathway
- Authors
- Zheng, X., Xie, B., Chen, D., Jiang, J., Zeng, T., Xiong, L., Shi, Q., Xie, H., Cai, Y., Liang, J., Chen, S., Qu, X., Xie, H.
- Source
- Full text @ Int. J. Mol. Sci.
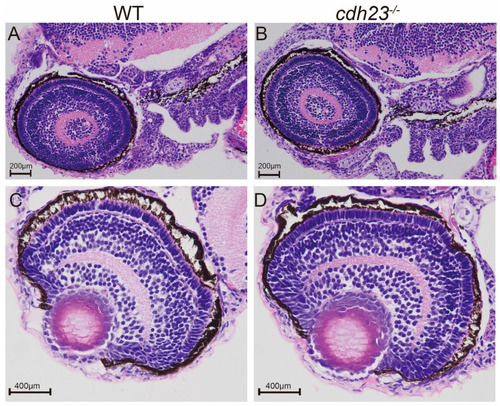
( PHENOTYPE:
|
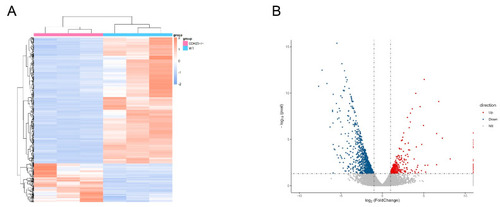
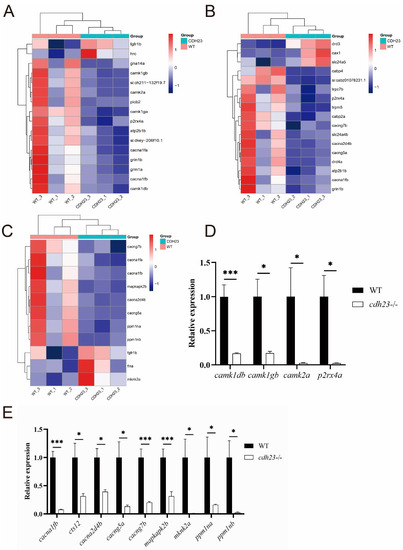
Transcriptome analyses of |
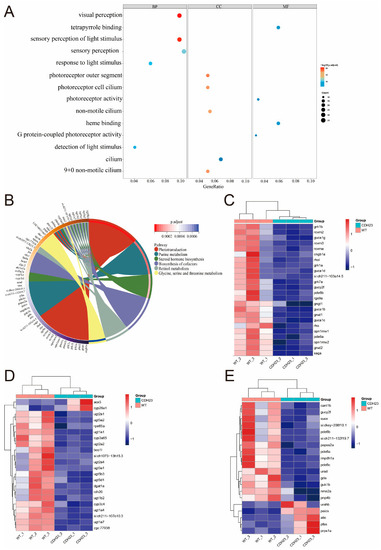
Pathways and differential gene expression associated with |
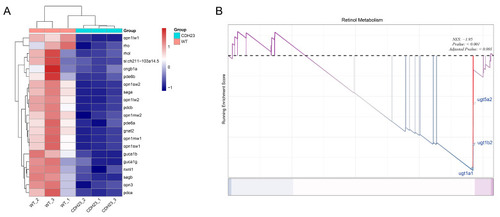
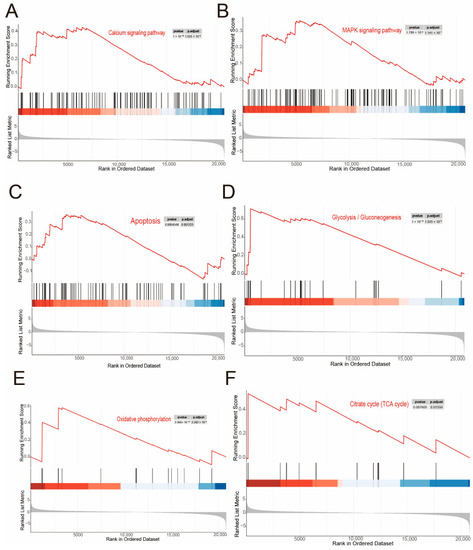
GO and GSEA. ( |
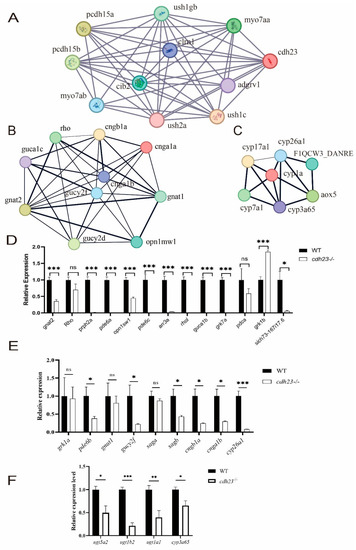
Visualization of network construction analysis of specific pathways. ( EXPRESSION / LABELING:
PHENOTYPE:
|
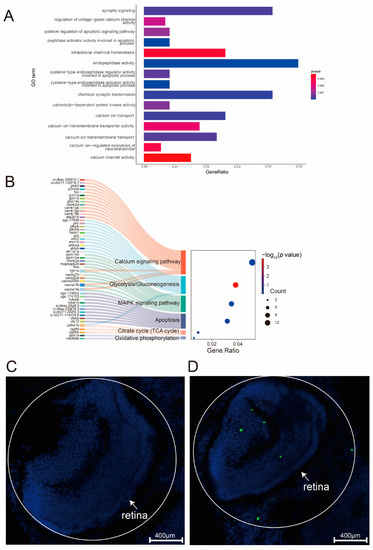
Enrichment analysis of differentially expressed genes in PHENOTYPE:
|
Identification of differentially expressed genes. ( |
Effect of EXPRESSION / LABELING:
PHENOTYPE:
|
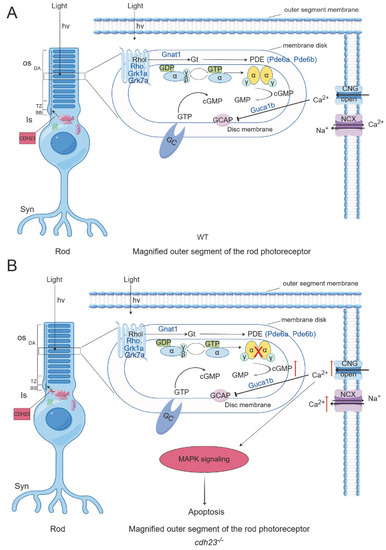
Schematic diagram of |