- Title
-
Stimulation of liver fibrosis by N2 neutrophils in Wilson's disease
- Authors
- Mi, X., Song, Y., Deng, C., Yan, J., Li, Z., Li, Y., Zheng, J., Yang, W., Gong, L., Shi, J.
- Source
- Full text @ Cell Mol Gastroenterol Hepatol
|
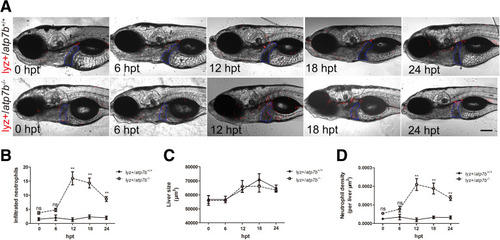
Neutrophils infiltrate into livers in atp7b-/- zebrafish indicated by lyz-positive neutrophils. (A) Representative images of lyz+/atp7b+/+ fish and lyz+/atp7b-/- fish after 0, 6, 12, 18, and 24 hours of Cu treatment. The livers are outlined in blue dashed lines. hpt, hours post-treatment. Scale bar: 200 μm. Liver (B) neutrophil count, (C) size, and (D) neutrophil density (liver neutrophil density = liver neutrophil count/liver size) in wild-type and mutant fish. Data are the means ± SEM, n = 10 fish/group. ∗∗P < .01. |
|
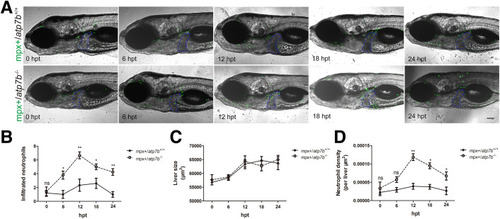
Neutrophils infiltrate into livers in atp7b-/- zebrafish indicated by mpx-positive neutrophils. (A) Representative images of mpx+/atp7b+/+ and mpx+/atp7b-/- fish after 0, 6, 12, 18, and 24 hours of Cu treatment. The livers are outlined in blue dashed lines. hpt, hours post-treatment. Scale bar: 200 μm. (B) Neutrophil count, (C) liver size, and (D) neutrophil density in wild-type and mutant fish livers. Data are the means ± SEM, n = 10 fish /group. ∗P < .05, ∗∗P < .01. |
|
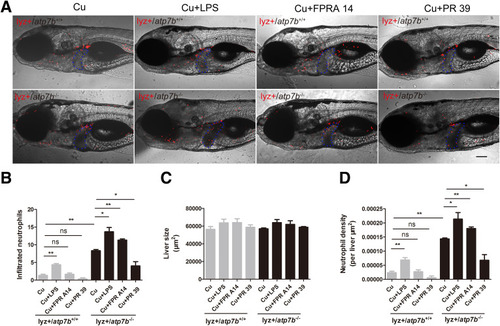
Effect of neutrophil activity–specific chemicals on liver-infiltrated neutrophils in atp7b-/- zebrafish. (A) Representative images of lyz+/atp7b+/+ and lyz+/atp7b-/- fish response to LPS, FPR A14, or PR 39 treatment. The livers are outlined in blue dashed lines. Scale bar: 200 μm. (B) Neutrophil count, (C) liver size, and (D) neutrophil density in wild-type and mutant fish livers response to LPS, FPR A14, or PR 39 treatment. Data are the means ± SEM, n = 10 fish/group. ∗P < .05, ∗∗P < .01. |
|
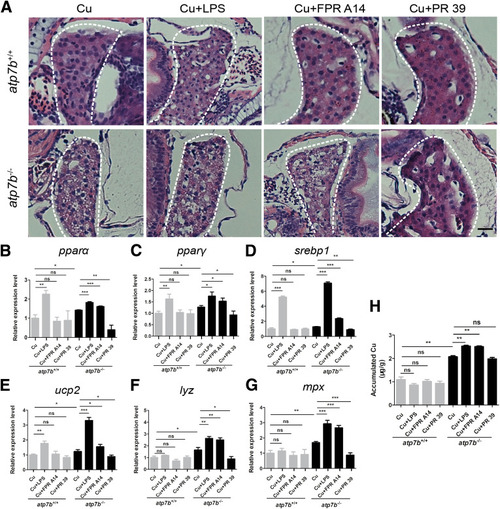
Effect of neutrophil activity–specific chemicals on liver pathogenesis in atp7b-/- zebrafish. (A) Representative H&E staining images of liver sections from wild-type and mutant fish in response to LPS, FPR A14, or PR 39. Scale bar: 200 μm. qPCR of gene expression changes in the lipogenic factors (B) pparα, (C) pparγ, (D) srebp1, and (E) ucp2, and neutrophil-specific factors (F) lyz and (G) mpx in both wild-type and mutant fish livers response to LPS, FPR A14, or PR 39. Data are the means ± SEM, n = 3 sets of 20 fish/group. ∗P < .05, ∗∗P < .01, ∗∗∗P < .001. (H) Inductively coupled plasma mass spectrometry of liver Cu content in wild-type and mutant fish in response to LPS, FPR A14, or PR 39. Data represent the means ± SEM, n = 3 sets of 1000 fish/group. ∗∗P < .01. |
|
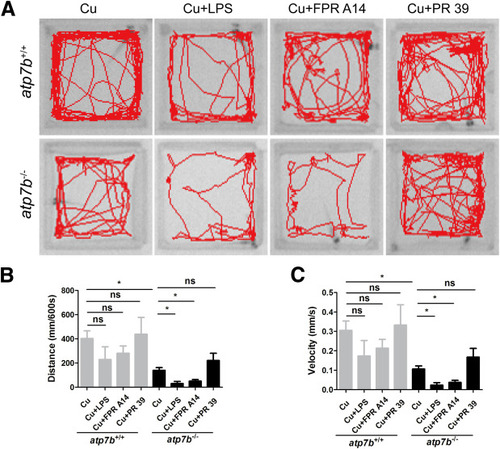
Effect of neutrophil activity–specific chemicals on movement deficits in atp7b-/- zebrafish. (A) Representative images of ANY-maze (Noldus) analysis of swimming patterns in both wild-type and mutant fish response to LPS, FPR A14, or PR 39 treatment. Swimming (B) distance and (C) velocity in both wild-type and mutant fish response to LPS, FPR A14, or PR 39 treatment. Data are the means ± SEM, n = 3~4 fish/group. ∗P < .05. |
|
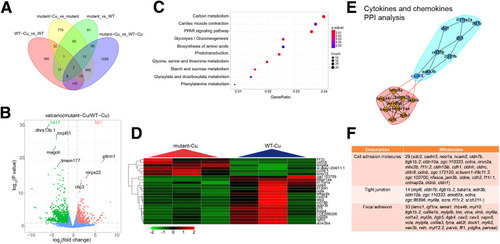
Gene transcriptional expression characteristics in atp7b-/- zebrafish liver neutrophils. Liver neutrophils were sorted from wild-type and mutant fish, and transcriptome analysis was performed. (A) Venn diagram showed that the most DEGs were detected in the comparison between Cu-treated wild-type groups and Cu-treated mutant groups. (B) Volcano plot showed 561 up-regulated genes and 1417 down-regulated genes among DEGs were detected from comparison between Cu-treated wild-type groups and Cu-treated mutant groups. (C) Kyoto Encyclopedia of Genes and Genomes pathway enrichment analysis of the DEGs from comparison between Cu-treated wild-type groups and Cu-treated mutant groups. (D) Heatmap of the significantly changed cytokines and chemokines from comparison between Cu-treated wild-type groups and Cu-treated mutant groups. (E) Protein-Protein Interaction Networks analysis of the significantly changed cytokines and chemokines. (F) Ingenuity Pathway Analysis of cell adhesion, tight junction, and focal adhesion in Cu-treated wild-type groups and Cu-treated mutant groups. WT, wild-type. |
|
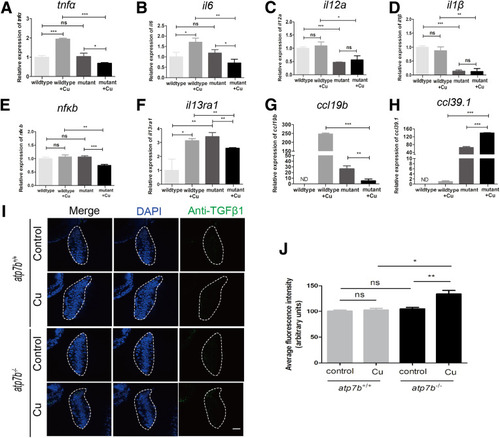
Experimental confirmation of the gene transcriptional profiles in atp7b-/- zebrafish neutrophils. qPCR of the selected significantly changed cytokines and chemokines including (A) tnfα, (B) il6, (C) il12a, (D) il1β, (E) nfκb, (F) il13ra1, (G) ccl19b, and (H) ccl39.1 in sorted neutrophils from wild-type and mutant fish with/without Cu challenge. (I and J) Immunofluorescence staining of anti-TGFβ1 in wild-type and mutant fish with/without Cu challenge. Representative images of (I) immunofluorescence staining using anti-TGFβ1, and (J) average fluorescence intensity was quantified. The livers are outlined by white dashed lines. 4′,6-Diamidino-2-phenylindole (DAPI) stains cell nuclei. Scale bar: 10 μm. (A–H and J) Data represent the means ± SEM. (A–H) n = 3 sets of neutrophils pooled from 600 larvae. (J) n = 10 fish/group. ∗P < .05, ∗∗P < .01, and ∗∗∗P < .001. |
|
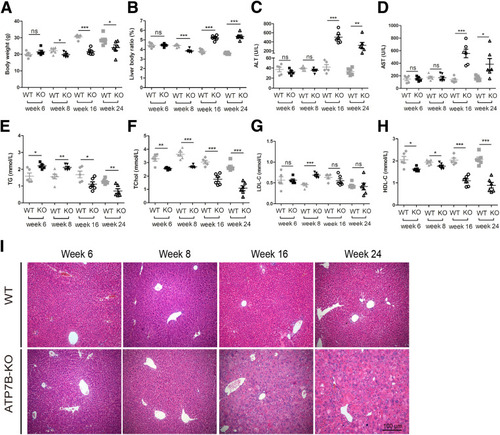
The development of liver defects in ATP7B-KO mice. (A) Body weight in 6-, 8-, 16-, and 24-week-old wild-type and ATP7B-KO mice. n = 5~6 mice/group. ∗P < .05, ∗∗∗P < .001. (B) Liver body ratio in 6-, 8-, 16-, and 24-week-old wild-type and ATP7B-KO mice. n = 5~6 mice/group. ∗∗∗P < .001. Serum activities of (C) ALT, (D) AST, (E) Triglyceride, (F) TChol, (G) low-density lipoprotein cholesterol (LDL-C), and (H) HDL-C in 6-, 8-, 16-, and 24-week-old wild-type and ATP7B-KO mice. n = 5~6 mice/group. ∗P < .05, ∗∗P < .01, and ∗∗∗P < .001. (I) Representative H&E images in liver sections from 6-, 8-, 16-, and 24-week-old wild-type and ATP7B-KO mice. Scale bar: 100 μm. WT, wild-type. |
|
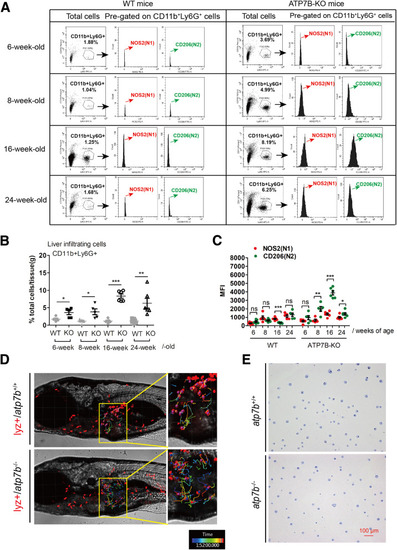
Liver infiltrating neutrophils display N2-polarization in ATP7B-KO mice and atp7b-/- zebrafish. (A) Flow cytometric analysis of N1 (CD11b+Ly6G+NOS2+) and N2 (CD11b+Ly6G+CD206+) neutrophil populations in total CD11b+Ly6G+ cells derived from the livers of wild-type and ATP7B-KO mice at 6, 8, 16, and 24 weeks of age. (B) Flow cytometric quantification of CD11b+Ly6G+ neutrophils from wild-type and ATP7B-KO mice livers at 6, 8, 16, and 24 weeks of age. (C) Flow cytometric quantification of liver N1 and N2 neutrophils from wild-type and ATP7B-KO mice at 6, 8, 16, and 24 weeks of age. (B and C) n = 5∼6 mice/group; unpaired 2-tailed t test. ∗P < .05, ∗∗P < .01, and ∗∗∗P < .001. (D) Tracking of neutrophil movement within and surrounding the liver area in wild-type and mutant fish. Selected neutrophils were tracked based on 2-hour time-lapse videos. (E) Representative images of nuclear patterns after Giemsa staining in sorted neutrophils from wild-type and mutant fish. Scale bar: 100 μm. WT, wild-type. |
|
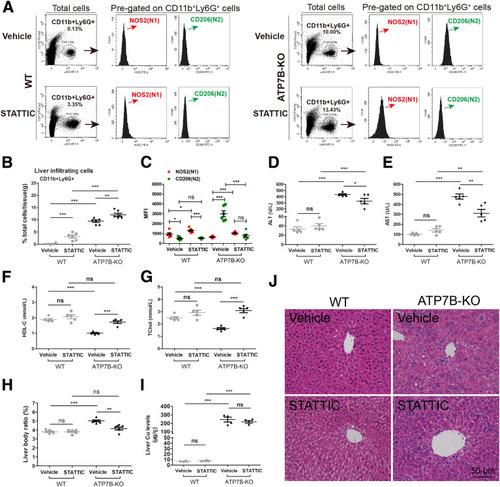
Ablating STAT3 in ATP7B-KO mice reduces liver N2-neutrophil polarization and alleviates liver pathology. (A) Flow cytometric analysis of N1 (CD11b+Ly6G+NOS2+) and N2 (CD11b+Ly6G+CD206+) neutrophil population in total CD11b+Ly6G+ cells derived from the livers of wild-type and ATP7B-KO mice treated with/without STATTIC. (B) Flow cytometric quantification of CD11b+Ly6G+ neutrophils from wild-type and ATP7B-KO mice livers treated with/without STATTIC. (C) Flow cytometric quantification of liver N1 and N2 neutrophils from wild-type and ATP7B-KO mice treated with/without STATTIC. (B and C) n = 6 mice/group; unpaired 2-tailed t test. ∗P < .05, ∗∗P < .01, and ∗∗∗P < .001. Serum activities of (D) ALT, (E) AST, (F) HDL-C, and (G) TChol in wild-type and ATP7B-KO mice treated with/without STATTIC. n = 5 mice/group. ∗P < .05, ∗∗P < .01, ∗∗∗P < .001. (H) Liver body ratio in wild-type and ATP7B-KO mice treated with/without STATTIC. n = 6 mice/group. ∗∗P < .01, ∗∗∗P < .001. (I) Liver Cu content in wild-type and ATP7B-KO mice treated with/without STATTIC. n = 4 mice/group. ∗∗∗P < .001. (J) Representative H&E images in liver sections from wild-type and ATP7B-KO mice treated with/without STATTIC. Scale bar: 50 μm. WT, wild-type. |
|
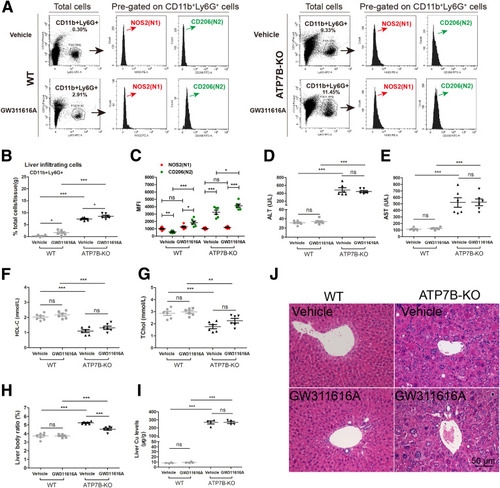
Pharmacologic inhibition of neutrophil elastase in ATP7B-KO mice increases liver N2-neutrophil polarization and aggravates liver pathology. (A) Flow cytometric analysis of N1 (CD11b+Ly6G+NOS2+) and N2 (CD11b+Ly6G+CD206+) neutrophil population in total CD11b+Ly6G+ cells derived from the livers of wild-type and ATP7B-KO mice treated with/without GW311616A. (B) Flow cytometric quantification of CD11b+Ly6G+ neutrophils from wild-type and ATP7B-KO mice livers treated with/without GW311616A. (C) Flow cytometric quantification of liver N1 and N2 neutrophils from wild-type and ATP7B-KO mice treated with/without GW311616A. (B and C) n = 6 mice/group, unpaired 2-tailed t test. ∗P < .05, ∗∗P < .01, and ∗∗∗P < .001. Serum activities of (D) ALT, (E) AST, (F) HDL-C, and (G) TChol in wild-type and ATP7B-KO mice treated with/without GW311616A. n = 6 mice/group. ∗∗P < .01, ∗∗∗P < .001. (H) Liver body ratio in wild-type and ATP7B-KO mice treated with/without GW311616A. n = 6 mice/group. ∗∗∗P < .001. (I) Liver Cu content in wild-type and ATP7B-KO mice treated with/without GW311616A. n = 4 mice/group. ∗∗∗P < .001. (J) Representative H&E images in liver sections from wild-type and ATP7B-KO mice treated with/without GW311616A. Scale bar: 50 μm. WT, wild-type. |
|
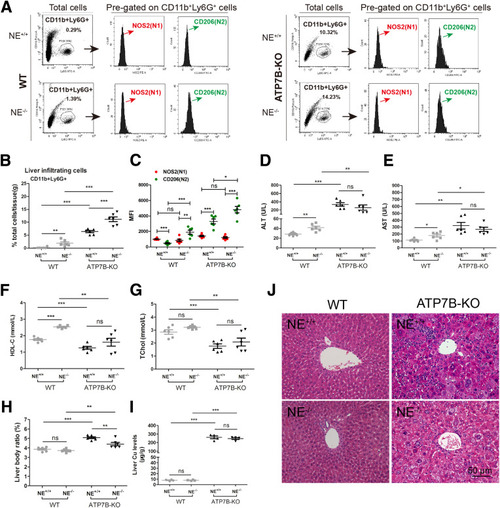
Genetic inhibition of neutrophil elastase in ATP7B-KO mice increases liver N2-neutrophil polarization and aggravates liver pathology. (A) Flow cytometric analysis of N1 (CD11b+Ly6G+NOS2+) and N2 (CD11b+Ly6G+CD206+) neutrophil populations in total CD11b+Ly6G+ cells derived from the livers of wild-type and ATP7B-KO mice with/without genetic deletion of neutrophil elastase. (B) Flow cytometric quantification of CD11b+Ly6G+ neutrophils from wild-type and ATP7B-KO mice livers with/without genetic deletion of neutrophil elastase. (C) Flow cytometric quantification of liver N1 and N2 neutrophils from wild-type and ATP7B-KO mice with or without genetic deletion of neutrophil elastase. (B and C) n = 6 mice/group; unpaired 2-tailed t test. ∗P < .05, ∗∗P < .01, and ∗∗∗P < .001. Serum activities of (D) ALT, (E) AST, (F) HDL-C, and (G) TChol in wild-type and ATP7B-KO mice with/without genetic deletion of neutrophil elastase. n = 6 mice/group. ∗P < .05, ∗∗P < .01, and ∗∗∗P < .001. (H) Liver body ratio in wild-type and ATP7B-KO mice with/without genetic deletion of neutrophil elastase. n = 6 mice/group. ∗∗P < .01, ∗∗∗P < .001. (I) Liver Cu content in wild-type and ATP7B-KO mice with/without genetic deletion of neutrophil elastase. n = 4 mice/group. ∗∗∗P < .001. (J) Representative H&E images in liver sections from wild-type and ATP7B-KO mice with/without genetic deletion of neutrophil elastase. Scale bar: 50 μm. WT, wild-type. |
|
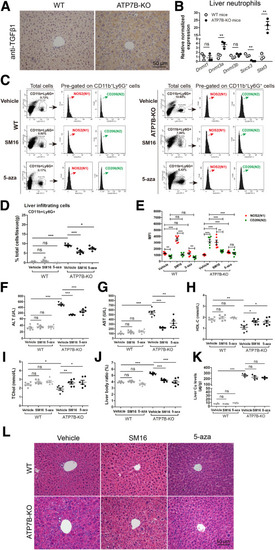
Inhibition of TGFβ1 signaling or DNA methylation in ATP7B-KO mice decreases liver N2-neutrophil polarization and improves liver pathology. (A) Representative immunohistochemical staining images of anti-TGFβ1 in wild-type and ATP7B-KO mice livers. Scale bar: 50 μm. (B) qPCR of gene expression changes in Dnmt1, Dnmt3a, Dnmt3b, Scos3, and Stat3 in wild-type and ATP7B-KO mice liver neutrophils. n = 3 sets of neutrophils pooled from 2∼3 mice. ∗∗P < .01. (C) Flow cytometric analysis of N1 (CD11b+Ly6G+NOS2+) and N2 (CD11b+Ly6G+CD206+) neutrophil population in total CD11b+Ly6G+ cells derived from the livers of wild-type and ATP7B-KO mice treated with/without SM16 or 5-aza. (D) Flow cytometric quantification of CD11b+Ly6G+ neutrophils from wild-type and ATP7B-KO mice livers treated with/without SM16 or 5-aza. (E) Flow cytometric quantification of liver N1 and N2 neutrophils from wild-type and ATP7B-KO mice treated with/without SM16 or 5-aza. (D and E) n = 6 mice/group, unpaired 2-tailed t test. ∗P < .05, ∗∗P < .01, and ∗∗∗P < .001. Serum activities of (F) ALT, (G) AST, (H) HDL-C, and (I) TChol in wild-type and ATP7B-KO mice treated with/without SM16 or 5-aza. n = 6 mice/group. ∗P < .05, ∗∗P < .01, and ∗∗∗P < .001. (J) Liver body ratio in wild-type and ATP7B-KO mice treated with/without SM16 or 5-aza. n = 6 mice/group. ∗∗∗P < .001. (K) Liver Cu content in wild-type and ATP7B-KO mice treated with/without SM16 or 5-aza. n = 4 mice/group. ∗∗∗P < .001. (L) Representative H&E images in liver sections from wild-type and ATP7B-KO mice treated with/without SM16 or 5-aza. Scale bar: 50 μm. WT, wild-type. |
|
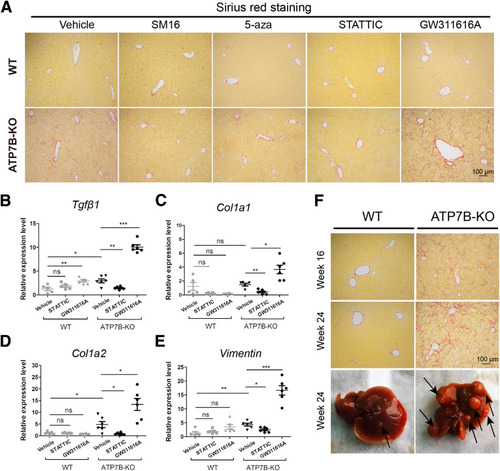
The effect of N2 neutrophils on liver fibrosis in ATP7B-KO mice. (A) Representative images of Sirius red staining in paraffin-embedded liver sections from vehicle-, SM16-, 5-aza–, STATTIC-, or GW311616A-treated mice. Scale bar: 100 μm. qPCR of fibrogenic genes in (B) Tgfβ1, (C) Col1a1, (D) Col1a2, and (E) vimentin in wild-type and ATP7B-KO mice liver upon vehicle, STATTIC, or GW311616A treatment. n = 5∼6 mice/group. ∗P < .05, ∗∗P < .01, and ∗∗∗P < .001. (F) Upper panels: Representative images of Sirius red staining in paraffin-embedded liver sections from 16-week-old and 24-week-old wild-type and ATP7B-KO mice. Scale bar: 100 μm. Lower panel: Macroscopic liver pathology in 24-week-old wild-type and ATP7B-KO mice. WT, wild-type. |
|
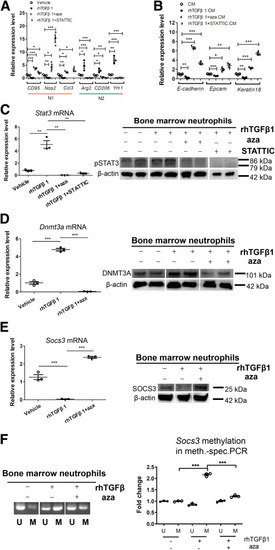
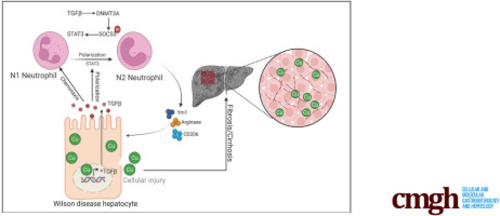
The TGFβ1–DNMT3A–STAT3 signaling axis mediates N2-neutrophil polarization in Wilson’s disease. (A) qPCR of gene expression changes in N1 markers (CD95, Nos2, and Ccl3) and N2 markers (Arg2, CD206, and Ym1) in bone marrow neutrophils treated with vehicle, rhTGFβ1 (Recombinant Human TGF-beta 1), rhTGFβ1 plus 5-aza, or rhTGFβ1 plus STATTIC. n = 3 sets of bone marrow neutrophils pooled from 2∼3 mice. ∗P < .05, ∗∗P < .01, and ∗∗∗P < .001. (B) qPCR of gene expression changes in epithelial–mesenchymal-transition markers (E-cadherin, Epcam, and Keratin 18) in ATP7B-KO HepG2 cells treated with culture medium from vehicle-, rhTGFβ1-, rhTGFβ1 plus 5-aza–, or rhTGFβ1 plus STATTIC–treated bone marrow neutrophils. n = 3 sets of ATP7B-KO HepG2 cells. ∗P < .05, ∗∗P < .01, and ∗∗∗P < .001. (C) The expression changes of Stat3 in bone marrow neutrophils treated with vehicle, rhTGFβ1, rhTGFβ1 plus 5-aza, or rhTGFβ1 plus STATTIC. Left panel: qPCR of Stat3 mRNA expression. n = 3 sets of bone marrow neutrophils pooled from 2∼3 mice. ∗∗P < .01. Right panel: Western blot of pSTAT3 protein expression. β-actin was used as internal control. n = 2 sets of bone marrow neutrophils pooled from 2∼3 mice. (D) The expression changes of Dnmt3a in bone marrow neutrophils treated with vehicle, rhTGFβ1, or rhTGFβ1 plus 5-aza. Left panel: qPCR of Dnmt3a mRNA expression. n = 3 sets of bone marrow neutrophils pooled from 2∼3 mice. ∗∗∗P < .001. Right panel: Western blot of DNMT3A protein expression. β-actin was used as internal control. n = 2 sets of bone marrow neutrophils pooled from 2∼3 mice. (E) The expression changes of Socs3 in bone marrow neutrophils treated with vehicle, rhTGFβ1, or rhTGFβ1 plus 5-aza. Left panel: qPCR of Socs3 mRNA expression. n = 3 sets of bone marrow neutrophils pooled from 2∼3 mice. ∗∗∗P < .001. Right panel: Western blot of SOCS3 protein expression. β-actin was used as internal control. n = 3 technical replicates/group. (F) Methylation-specific PCR in Socs3 promoter in bone marrow neutrophils treated with vehicle, rhTGFβ1, or rhTGFβ1 plus 5-aza. Left panel: Representative images of methylation-specific PCR in Socs3 promoter. Right panel: Quantification of band levels by ImageJ. M, methylated; U, unmethylated. n = 3 sets of bone marrow neutrophils pooled from 2∼3 mice. ∗∗∗P < .001. CM, culture medium. |
|
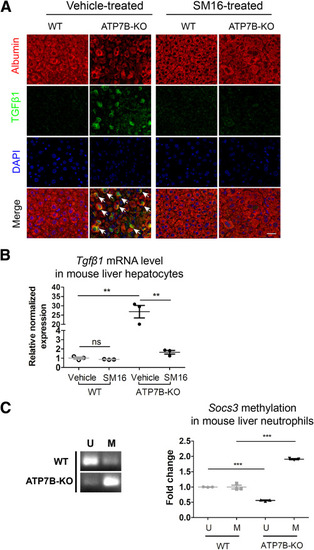
TGFβ1 is highly increased in hepatocytes in ATP7B-KO mice. (A) Formalin-fixed mouse liver tissue sections from SM16-treated or vehicle-treated wild-type and ATP7B-KO mice were subjected to immunofluorescence staining of anti-TGFβ1 and anti-albumin. Representative images of TGFβ1 (green), albumin (red), and nuclei (blue) are shown. Arrows indicate TGFβ1-positive hepatocytes. Scale bar: 40 μm. (B) qPCR of mRNA levels of Tgfβ1 in liver hepatocytes isolated from wild-type and ATP7B-KO mice upon SM16 or vehicle treatment. n = 3 sets of liver hepatocytes pooled from 2∼3 mice. ∗∗P < .01. (C) Methylation-specific PCR in Socs3 promoter in liver neutrophils from wild-type and ATP7B-KO mice. Left panel: Representative images of methylation-specific PCR in Socs3 promoter. Right panel: Quantification of band levels by ImageJ. M, methylated; U, unmethylated. n = 3 sets of liver neutrophils pooled from 2∼3 mice. ∗∗∗P < .001. DAPI, 4′,6-diamidino-2-phenylindole; WT, wild-type. |
|
STAT3 is highly increased in liver neutrophils in ATP7B-KO mice. (A) Formalin-fixed mouse liver tissue sections from STATTIC-treated or vehicle-treated wild-type and ATP7B-KO mice were subjected to immunofluorescence staining of anti-pSTAT3 and anti-Ly6G. Representative images of pSTAT3 (green), Ly6G (red), and nuclei (blue) are shown. Arrows indicate pSTAT3-positive liver neutrophils. Scale bar: 40 μm. (B) qPCR of mRNA levels of Stat3 in liver neutrophils isolated from wild-type and ATP7B-KO mice upon STATTIC or vehicle treatment. n = 3 sets of liver neutrophils pooled from 2∼3 mice. ∗∗P < .01. DAPI, 4′,6-diamidino-2-phenylindole; WT, wild-type. |
|
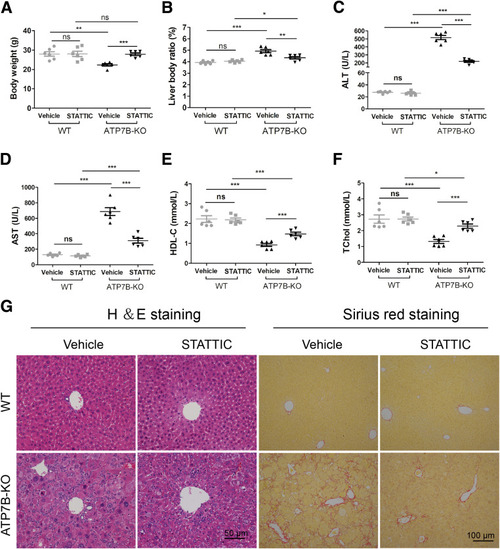
The long-term effect of N2 neutrophils on liver injury phenotype in ATP7B-KO mice. (A and B) Body weight and liver body ratio in wild-type and ATP7B-KO mice 4 months after STATTIC treatment. n = 6 mice/group. ∗P < .05, ∗∗P < .01, and ∗∗∗P < .001. Serum activities of (C) ALT, (D) AST, (E) HDL-C, and (F) TChol in wild-type and ATP7B-KO mice 4 months after STATTIC treatment. n = 6 mice/group. ∗P < .05, ∗∗∗P < .001. (G) Pathologic changes in liver sections from wild-type and ATP7B-KO mice 4 months after STATTIC treatment. Left panel: Representative H&E images in paraffin-embedded liver sections. Scale bar: 50 μm. Right panel: Representative images of Sirius red staining in paraffin-embedded liver sections. Scale bar: 100 μm. WT, wild-type. |
|
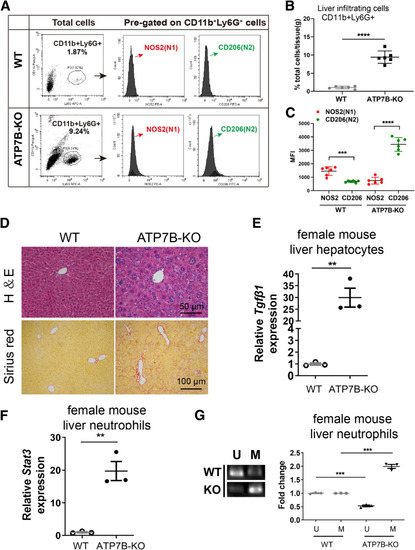
The N2 neutrophils and liver injury phenotype also were observed in female ATP7B-KO mice. (A) Flow cytometric analysis of N1 (CD11b+Ly6G+NOS2+) and N2 (CD11b+Ly6G+CD206+) neutrophil populations in total CD11b+Ly6G+ cells derived from the livers of female wild-type and ATP7B-KO mice. (B) Flow cytometric quantification of CD11b+Ly6G+ neutrophils from female wild-type and ATP7B-KO mice livers. (C) Flow cytometric quantification of liver N1 and N2 neutrophils from female wild-type and ATP7B-KO mice. (B and C) n = 6 mice/group; unpaired 2-tailed t test. ∗∗∗P < .001, ∗∗∗∗P < .0001. (D) Pathologic changes in liver sections from female wild-type and ATP7B-KO mice at age 16 weeks. Upper panel: Representative H&E images in paraffin-embedded liver sections. Scale bar: 50 μm. Lower panel: Representative images of Sirius red staining in paraffin-embedded liver sections. Scale bar: 100 μm. (E) qPCR of mRNA levels of Tgfβ1 in liver hepatocytes isolated from female wild-type and ATP7B-KO mice. n = 3 sets of liver hepatocytes pooled from 2∼3 mice. ∗∗P < .01. (F) qPCR of mRNA levels of Stat3 in liver neutrophils isolated from female wild-type and ATP7B-KO mice. n = 3 sets of liver neutrophils pooled from 2∼3 mice. ∗∗P < .01. (G) Methylation-specific PCR in Socs3 promoter in liver neutrophils from female wild-type and ATP7B-KO mice. Left panel: Representative images of methylation-specific PCR in Socs3 promoter. Right panel: Quantification of band levels by ImageJ. M, methylated; U, unmethylated. n = 3 sets of liver neutrophils pooled from 2∼3 mice. ∗∗∗P < .001. WT, wild-type. |
|
|

