
Fig. 7
- ID
- ZDB-IMAGE-240130-23
- Publication
- Mi et al., 2023 - Stimulation of liver fibrosis by N2 neutrophils in Wilson's disease
- All Figures
- Figures for Mi et al., 2023
|
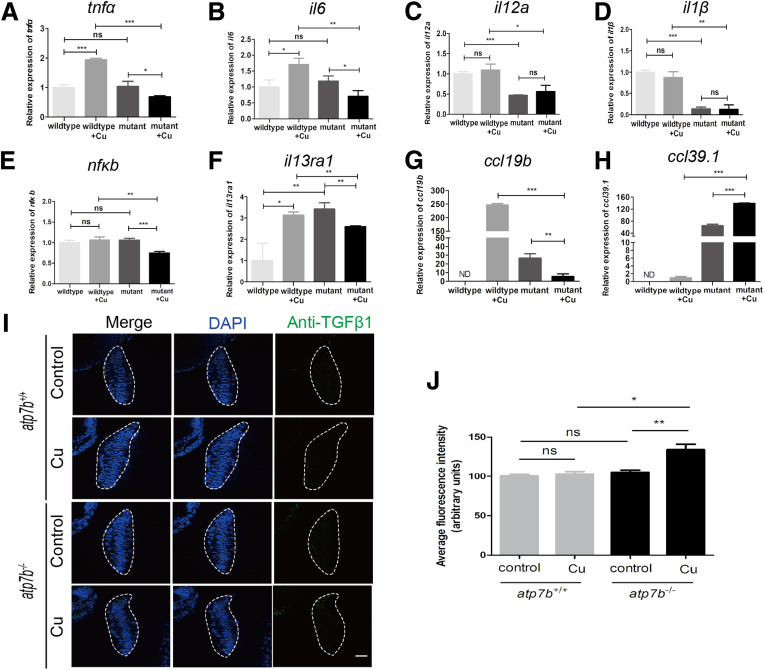
Fig. 7 Experimental confirmation of the gene transcriptional profiles in atp7b-/- zebrafish neutrophils. qPCR of the selected significantly changed cytokines and chemokines including (A) tnfα, (B) il6, (C) il12a, (D) il1β, (E) nfκb, (F) il13ra1, (G) ccl19b, and (H) ccl39.1 in sorted neutrophils from wild-type and mutant fish with/without Cu challenge. (I and J) Immunofluorescence staining of anti-TGFβ1 in wild-type and mutant fish with/without Cu challenge. Representative images of (I) immunofluorescence staining using anti-TGFβ1, and (J) average fluorescence intensity was quantified. The livers are outlined by white dashed lines. 4′,6-Diamidino-2-phenylindole (DAPI) stains cell nuclei. Scale bar: 10 μm. (A–H and J) Data represent the means ± SEM. (A–H) n = 3 sets of neutrophils pooled from 600 larvae. (J) n = 10 fish/group. ∗P < .05, ∗∗P < .01, and ∗∗∗P < .001.