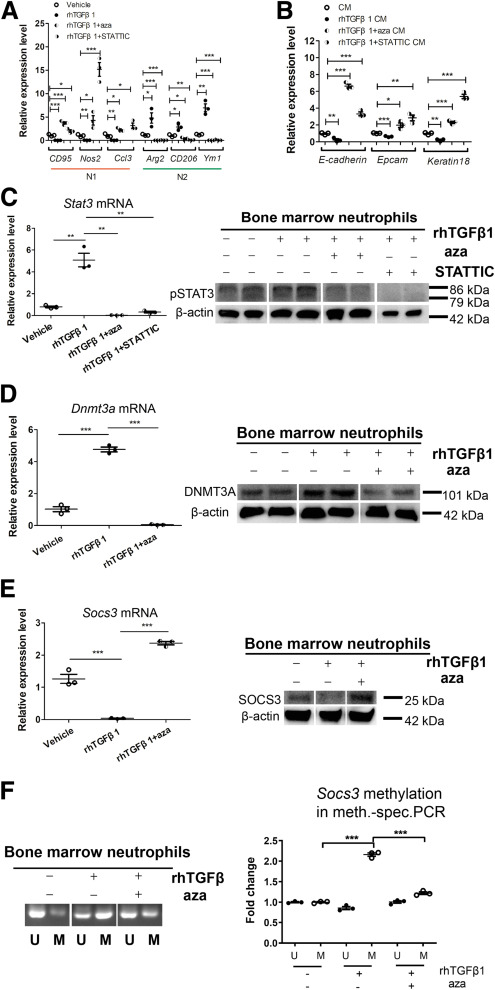
Fig. 15 The TGFβ1–DNMT3A–STAT3 signaling axis mediates N2-neutrophil polarization in Wilson’s disease. (A) qPCR of gene expression changes in N1 markers (CD95, Nos2, and Ccl3) and N2 markers (Arg2, CD206, and Ym1) in bone marrow neutrophils treated with vehicle, rhTGFβ1 (Recombinant Human TGF-beta 1), rhTGFβ1 plus 5-aza, or rhTGFβ1 plus STATTIC. n = 3 sets of bone marrow neutrophils pooled from 2∼3 mice. ∗P < .05, ∗∗P < .01, and ∗∗∗P < .001. (B) qPCR of gene expression changes in epithelial–mesenchymal-transition markers (E-cadherin, Epcam, and Keratin 18) in ATP7B-KO HepG2 cells treated with culture medium from vehicle-, rhTGFβ1-, rhTGFβ1 plus 5-aza–, or rhTGFβ1 plus STATTIC–treated bone marrow neutrophils. n = 3 sets of ATP7B-KO HepG2 cells. ∗P < .05, ∗∗P < .01, and ∗∗∗P < .001. (C) The expression changes of Stat3 in bone marrow neutrophils treated with vehicle, rhTGFβ1, rhTGFβ1 plus 5-aza, or rhTGFβ1 plus STATTIC. Left panel: qPCR of Stat3 mRNA expression. n = 3 sets of bone marrow neutrophils pooled from 2∼3 mice. ∗∗P < .01. Right panel: Western blot of pSTAT3 protein expression. β-actin was used as internal control. n = 2 sets of bone marrow neutrophils pooled from 2∼3 mice. (D) The expression changes of Dnmt3a in bone marrow neutrophils treated with vehicle, rhTGFβ1, or rhTGFβ1 plus 5-aza. Left panel: qPCR of Dnmt3a mRNA expression. n = 3 sets of bone marrow neutrophils pooled from 2∼3 mice. ∗∗∗P < .001. Right panel: Western blot of DNMT3A protein expression. β-actin was used as internal control. n = 2 sets of bone marrow neutrophils pooled from 2∼3 mice. (E) The expression changes of Socs3 in bone marrow neutrophils treated with vehicle, rhTGFβ1, or rhTGFβ1 plus 5-aza. Left panel: qPCR of Socs3 mRNA expression. n = 3 sets of bone marrow neutrophils pooled from 2∼3 mice. ∗∗∗P < .001. Right panel: Western blot of SOCS3 protein expression. β-actin was used as internal control. n = 3 technical replicates/group. (F) Methylation-specific PCR in Socs3 promoter in bone marrow neutrophils treated with vehicle, rhTGFβ1, or rhTGFβ1 plus 5-aza. Left panel: Representative images of methylation-specific PCR in Socs3 promoter. Right panel: Quantification of band levels by ImageJ. M, methylated; U, unmethylated. n = 3 sets of bone marrow neutrophils pooled from 2∼3 mice. ∗∗∗P < .001. CM, culture medium.
Image
Figure Caption
Acknowledgments
This image is the copyrighted work of the attributed author or publisher, and
ZFIN has permission only to display this image to its users.
Additional permissions should be obtained from the applicable author or publisher of the image.
Full text @ Cell Mol Gastroenterol Hepatol

