
Fig. 6
- ID
- ZDB-FIG-240130-22
- Publication
- Mi et al., 2023 - Stimulation of liver fibrosis by N2 neutrophils in Wilson's disease
- Other Figures
- All Figure Page
- Back to All Figure Page
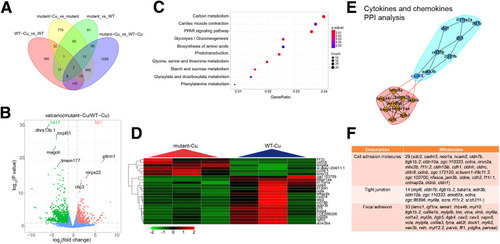
Gene transcriptional expression characteristics in atp7b-/- zebrafish liver neutrophils. Liver neutrophils were sorted from wild-type and mutant fish, and transcriptome analysis was performed. (A) Venn diagram showed that the most DEGs were detected in the comparison between Cu-treated wild-type groups and Cu-treated mutant groups. (B) Volcano plot showed 561 up-regulated genes and 1417 down-regulated genes among DEGs were detected from comparison between Cu-treated wild-type groups and Cu-treated mutant groups. (C) Kyoto Encyclopedia of Genes and Genomes pathway enrichment analysis of the DEGs from comparison between Cu-treated wild-type groups and Cu-treated mutant groups. (D) Heatmap of the significantly changed cytokines and chemokines from comparison between Cu-treated wild-type groups and Cu-treated mutant groups. (E) Protein-Protein Interaction Networks analysis of the significantly changed cytokines and chemokines. (F) Ingenuity Pathway Analysis of cell adhesion, tight junction, and focal adhesion in Cu-treated wild-type groups and Cu-treated mutant groups. WT, wild-type. |