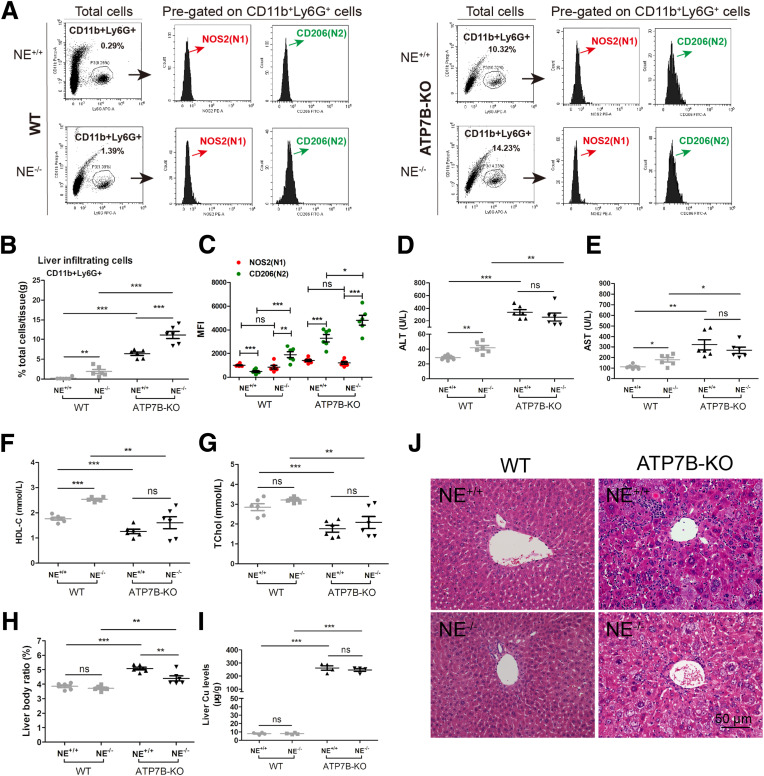
Fig. 12 Genetic inhibition of neutrophil elastase in ATP7B-KO mice increases liver N2-neutrophil polarization and aggravates liver pathology. (A) Flow cytometric analysis of N1 (CD11b+Ly6G+NOS2+) and N2 (CD11b+Ly6G+CD206+) neutrophil populations in total CD11b+Ly6G+ cells derived from the livers of wild-type and ATP7B-KO mice with/without genetic deletion of neutrophil elastase. (B) Flow cytometric quantification of CD11b+Ly6G+ neutrophils from wild-type and ATP7B-KO mice livers with/without genetic deletion of neutrophil elastase. (C) Flow cytometric quantification of liver N1 and N2 neutrophils from wild-type and ATP7B-KO mice with or without genetic deletion of neutrophil elastase. (B and C) n = 6 mice/group; unpaired 2-tailed t test. ∗P < .05, ∗∗P < .01, and ∗∗∗P < .001. Serum activities of (D) ALT, (E) AST, (F) HDL-C, and (G) TChol in wild-type and ATP7B-KO mice with/without genetic deletion of neutrophil elastase. n = 6 mice/group. ∗P < .05, ∗∗P < .01, and ∗∗∗P < .001. (H) Liver body ratio in wild-type and ATP7B-KO mice with/without genetic deletion of neutrophil elastase. n = 6 mice/group. ∗∗P < .01, ∗∗∗P < .001. (I) Liver Cu content in wild-type and ATP7B-KO mice with/without genetic deletion of neutrophil elastase. n = 4 mice/group. ∗∗∗P < .001. (J) Representative H&E images in liver sections from wild-type and ATP7B-KO mice with/without genetic deletion of neutrophil elastase. Scale bar: 50 μm. WT, wild-type.
Image
Figure Caption
Acknowledgments
This image is the copyrighted work of the attributed author or publisher, and
ZFIN has permission only to display this image to its users.
Additional permissions should be obtained from the applicable author or publisher of the image.
Full text @ Cell Mol Gastroenterol Hepatol

