Fig. 9
- ID
- ZDB-FIG-240130-25
- Publication
- Mi et al., 2023 - Stimulation of liver fibrosis by N2 neutrophils in Wilson's disease
- Other Figures
- All Figure Page
- Back to All Figure Page
|
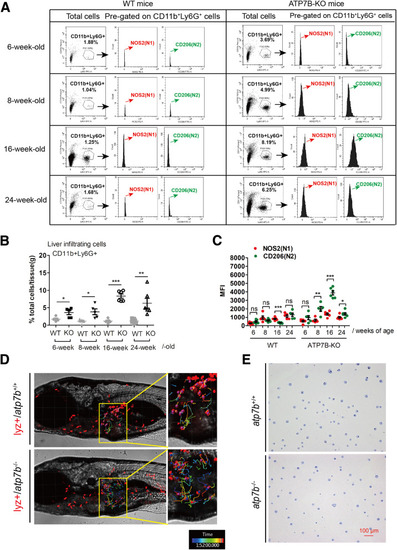
Liver infiltrating neutrophils display N2-polarization in ATP7B-KO mice and atp7b-/- zebrafish. (A) Flow cytometric analysis of N1 (CD11b+Ly6G+NOS2+) and N2 (CD11b+Ly6G+CD206+) neutrophil populations in total CD11b+Ly6G+ cells derived from the livers of wild-type and ATP7B-KO mice at 6, 8, 16, and 24 weeks of age. (B) Flow cytometric quantification of CD11b+Ly6G+ neutrophils from wild-type and ATP7B-KO mice livers at 6, 8, 16, and 24 weeks of age. (C) Flow cytometric quantification of liver N1 and N2 neutrophils from wild-type and ATP7B-KO mice at 6, 8, 16, and 24 weeks of age. (B and C) n = 5∼6 mice/group; unpaired 2-tailed t test. ∗P < .05, ∗∗P < .01, and ∗∗∗P < .001. (D) Tracking of neutrophil movement within and surrounding the liver area in wild-type and mutant fish. Selected neutrophils were tracked based on 2-hour time-lapse videos. (E) Representative images of nuclear patterns after Giemsa staining in sorted neutrophils from wild-type and mutant fish. Scale bar: 100 μm. WT, wild-type. |

