Hatching and mortality rate of zebrafish larvae. (A) Representative images of the morphology of zebrafish exposed to different groups at 48 and 72 hpf (scale bar, 1 mm). (B) Hatching rates at 48 and 72 hpf. (C) Mortality rate of zebrafish in different groups from 24 to 120 hpf.

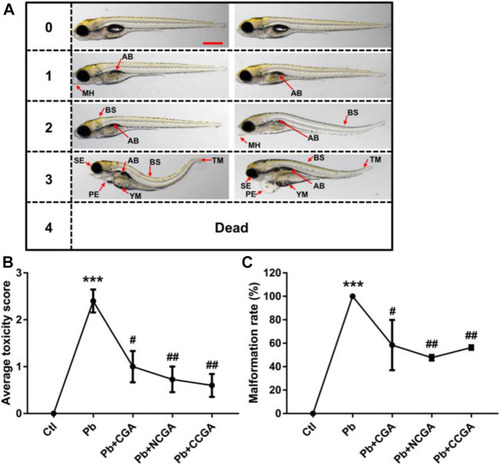
Micrographs, average toxicity scores, and malformation rate. (A) Representative images of toxicity score from 0 to 4 at 120 hpf. Zebrafish malformation was scored from level 0 to level 4.0, zebrafish developed normally; 1–3, zebrafish had slight-to-severe defects; 4, embryonic lethality. Two images for each of semiquantitative toxicity scoring indicate that both of these abnormalities are ranked as the same toxicity score (scale bar, 500 μm). (B) Average toxicity score at 120 hpf (n = 6); ***p < 0.001 vs. control and #p < 0.05, ##p < 0.01 vs. Pb. (C) Pb-induced phenotypic defects and malformation rate (n = 15); ***p < 0.001 vs. control and #p < 0.05, ##p < 0.01 vs. Pb.

Representative images of DA neuron of zebrafish and its analysis. (A) Representative fluorescence microscopy images of vmat2:GFP zebrafish at 120 hpf. DA neurons were indicated by the red brackets. Enlarged images are shown to improve visualization of DA neuron morphology (scale bar, 100 μm). (B) Statistical analysis of the length of the DA neuron region (n = 6); ***p < 0.001 vs. control and #p < 0.05, ###p < 0.001 vs. Pb.

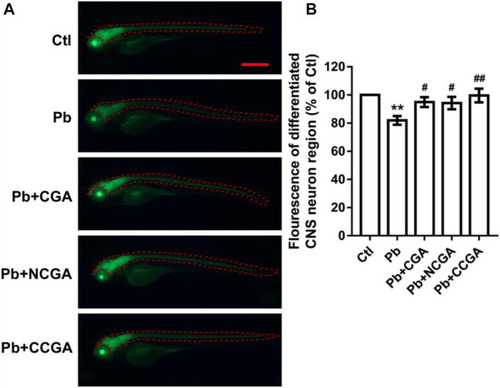
Representative fluorescence images of differentiated CNS neuron region of zebrafish and its analysis. (A) Representative fluorescence microscopy images of elavl3:EGFP zebrafish at 120 hpf (scale bar, 500 μm). (B) Statistical analysis of the fluorescence of differentiated CNS neuron region (n = 6);**p < 0.01 vs. control and #p < 0.05, ##p < 0.01 vs. Pb.

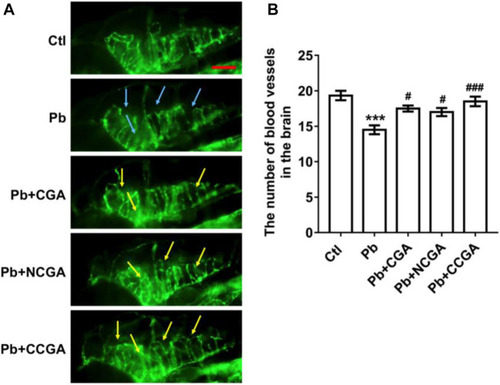
Representative images of blood vasculature of zebrafish and its analysis. (A) Representative fluorescence microscopy images of fli1:GFP zebrafish at 120 hpf. Loss of vasculature was indicated by blue arrows. Recovery of vasculature was indicated by yellow arrows. (scale bar, 100 μm). (B) Statistical analysis of the number of blood vessels in the brain (n = 6). ***p < 0.001 vs. control and #p < 0.05, ###p < 0.001 vs. Pb.

Swimming behavior test of zebrafish at 120 hpf. (A) Total distance traveled in 20 min (n = 10); ***p < 0.001 vs. control and ##p < 0.01, ###p < 0.001 vs. Pb. (B) The digital tracking map. High-speed (v > 5 cm/s) movement is represented in red lines, medium-speed (2 cm/s < v < 5 cm/s) movement is depicted in green lines, and low-speed (v < 2 cm/s) movement is represented in black lines. (C) The swimming speed of zebrafish larvae with different treatment. Average speed in every 60 s was calculated.

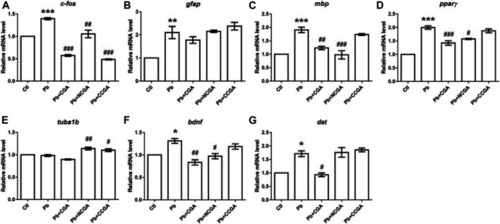
Transcription of genes related to neurodevelopment. The graph plot is represented as fold changes in the mRNA expression of c-fos (A), gfap (B), mbp (C), pparγ (D), tuba1b (E), bdnf (F), and dat (G). Data were represented as mean ± SEM, n = 3, and statistically analyzed by one-way ANOVA followed by Dunnett’s multiple comparison test. *p < 0.05, **p < 0.01, ***p < 0.001 vs. control and #p < 0.05, ##p < 0.01, ###p < 0.001 vs. Pb.

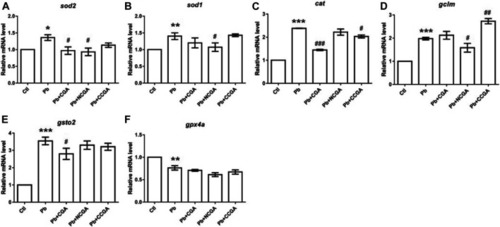
Transcription of genes related to oxidative stress. The graph plot is represented as fold changes in the mRNA expression of sod2 (A), sod1 (B), cat (C), gclm (D), gsto2 (E), and gpx4a (F). Data were represented as mean ± SEM, n = 3, and statistically analyzed by one-way ANOVA followed by Dunnett’s multiple comparison test. *p < 0.05, **p < 0.01, ***p < 0.001 vs. control and #p < 0.05, ##p < 0.01, ###p < 0.001 vs. Pb.

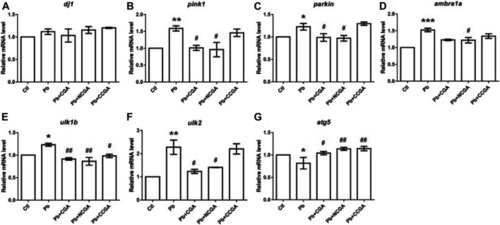
Transcription of genes related to parkinsonian and autophagy. The graph plot is represented as fold changes in the mRNA expression of dj1 (A), pink1 (B), parkin (C), ambra1a (D), ulk1b (E), ulk2 (F), and atg5 (G). Data were represented as mean ± SEM, n = 3, and statistically analyzed by one-way ANOVA followed by Dunnett’s multiple comparison test. *p < 0.05, **p < 0.01, ***p < 0.001 vs. control and #p < 0.05, ##p < 0.01, ###p < 0.001 vs. Pb.

Schematic representation of protective effect of CGA, NCGA, and CCGA against Pb-induced developmental neurotoxicity co-treatment of CGA, NCGA, and CCGA alleviated developmental malformation, reduced toxicity score, increased the length of DA neuron region, protected brain vasculature and neuron differentiation in the CNS, ameliorated locomotor impairment, modulated neurodevelopmental genes (c-fos, gfap, mbp, pparγ, tuba1b, bdnf, and dat), oxidative stress-related genes (sod2, sod1, cat, gclm, gsto2, and gpx4a), and parkinsonian and autophagy-related genes (dj1, pink1, parkin, ambra1a, ulk1b, ulk2, and atg5). Summing up, our study demonstrates that co-treatment with CGA and its analogues NCGA and CCGA protects against Pb-induced developmental neurotoxicity. The protective mechanism of CGA, NCGA, and CCGA co-treatment might not be only due to the inhibition of apoptosis also protection of brain vasculature but also due to the inhibition of Pb exposure induced oxidative stress and autophagy in zebrafish (Figure 10). Our results provide proof of concept that CGA, NCGA, and CCGA might represent the future treatment against Pb poisoning.

Acknowledgments
This image is the copyrighted work of the attributed author or publisher, and ZFIN has permission only to display this image to its users. Additional permissions should be obtained from the applicable author or publisher of the image. Full text @ Front Mol Biosci