
IMAGE
FIGURE 6
- ID
- ZDB-IMAGE-210630-39
- Publication
- Ji et al., 2021 - Protective Effect of Chlorogenic Acid and Its Analogues on Lead-Induced Developmental Neurotoxicity Through Modulating Oxidative Stress and Autophagy
- All Figures
- Figures for Ji et al., 2021
Image
|
Figure Caption
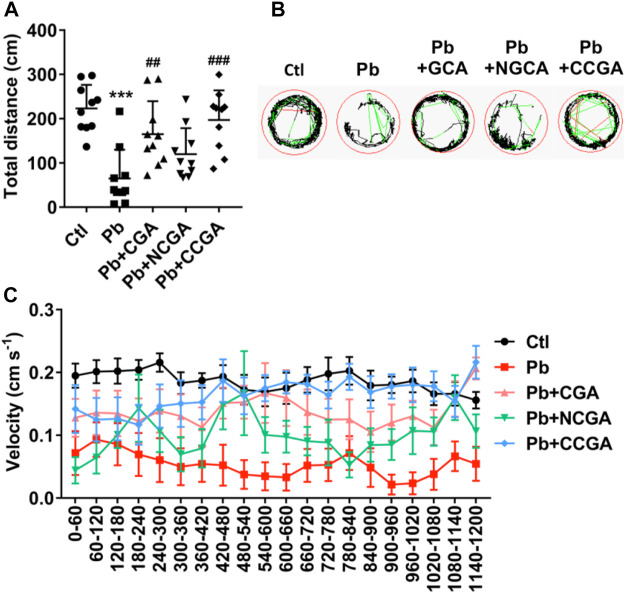
FIGURE 6
Swimming behavior test of zebrafish at 120 hpf.
Figure Data
Acknowledgments
This image is the copyrighted work of the attributed author or publisher, and
ZFIN has permission only to display this image to its users.
Additional permissions should be obtained from the applicable author or publisher of the image.
Full text @ Front Mol Biosci