
FIGURE 2
- ID
- ZDB-IMAGE-210630-34
- Publication
- Ji et al., 2021 - Protective Effect of Chlorogenic Acid and Its Analogues on Lead-Induced Developmental Neurotoxicity Through Modulating Oxidative Stress and Autophagy
- All Figures
- Figures for Ji et al., 2021
|
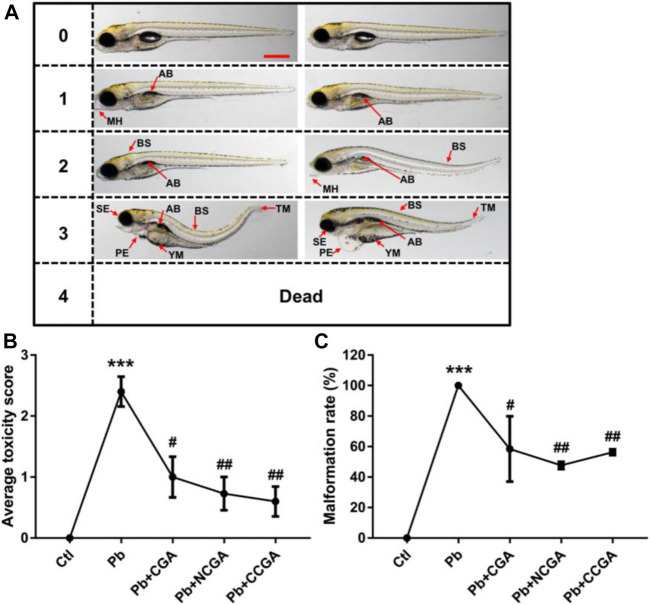
FIGURE 2
Micrographs, average toxicity scores, and malformation rate.