FIGURE

FIGURE 2

ID
ZDB-FIG-210630-31
Publication
Ji et al., 2021 - Protective Effect of Chlorogenic Acid and Its Analogues on Lead-Induced Developmental Neurotoxicity Through Modulating Oxidative Stress and Autophagy
Other Figures
All Figure Page
Back to All Figure Page
FIGURE 2

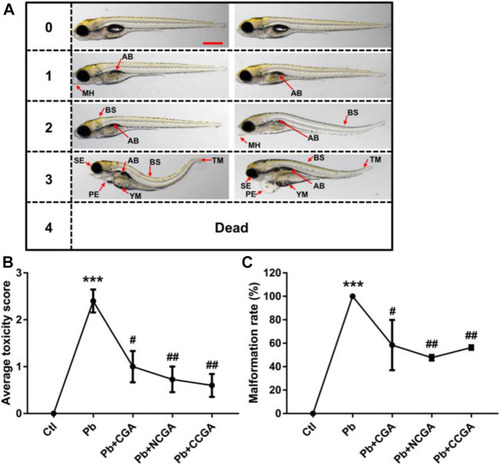
Micrographs, average toxicity scores, and malformation rate. (A) Representative images of toxicity score from 0 to 4 at 120 hpf. Zebrafish malformation was scored from level 0 to level 4.0, zebrafish developed normally; 1–3, zebrafish had slight-to-severe defects; 4, embryonic lethality. Two images for each of semiquantitative toxicity scoring indicate that both of these abnormalities are ranked as the same toxicity score (scale bar, 500 μm). (B) Average toxicity score at 120 hpf (n = 6); ***p < 0.001 vs. control and #p < 0.05, ##p < 0.01 vs. Pb. (C) Pb-induced phenotypic defects and malformation rate (n = 15); ***p < 0.001 vs. control and #p < 0.05, ##p < 0.01 vs. Pb.

Expression Data

Expression Detail
Antibody Labeling
Phenotype Data
Fish:
Conditions:
Observed In:
Stage: Day 5

Phenotype Detail
Acknowledgments
This image is the copyrighted work of the attributed author or publisher, and ZFIN has permission only to display this image to its users. Additional permissions should be obtained from the applicable author or publisher of the image. Full text @ Front Mol Biosci