
- Title
-
The Vascular Niche Regulates Hematopoietic Stem and Progenitor Cell Lodgment and Expansion via klf6a-ccl25b
- Authors
- Xue, Y., Lv, J., Zhang, C., Wang, L., Ma, D., Liu, F.
- Source
- Full text @ Dev. Cell
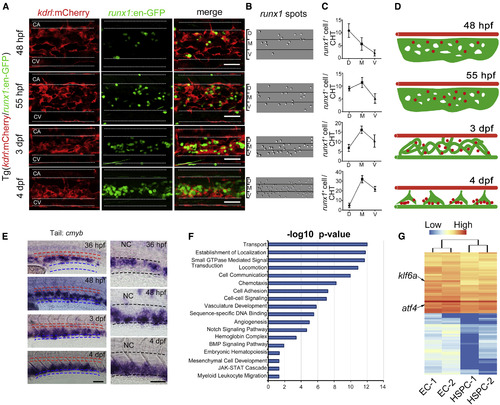
HSPC Localization in Zebrafish CHT, and RNA-Seq Analysis (A) In vivo imaging of Tg (kdrl:mCherry/runx1:en-GFP) showing the detailed localization of HSPCs in the CHT during dynamic developmental processes. At 48 hpf, runx1+ cells mainly localized next to the ventral wall of caudal artery and then migrated into the venous plexus at 55 hpf. At a later stage, i.e., 3 dpf and 4 dpf, runx1+ cells seeded the dorsal wall of caudal vein in the CHT. The white dashed lines indicate the outlines of caudal artery (CA) and caudal vein (CV), respectively. Scale bars, 30 μm. (B) The runx1 spots in the CHT were achieved from runx1:en-GFP+ cells in (A) via imaging by Imaris processing. (C) The statistical data of runx1 spots in D/M/V region during developmental stages. (D) The model of dynamic development of CVP and associated HSPCs. The red color marks caudal artery, the green color marks CVP, and red dots mark HSPCs. (E) Expression of cmyb in the CHT at successive developmental stages. The red dashed lines mark the caudal artery and blue dashed lines mark the main caudal vein. The right panels are magnified images of cmyb expression in the CHT. The black dashed lines indicate the boundary between the caudal artery and vein. NC, notochord. Scale bars, 30 μm. (F) DAVID gene ontology (GO) analysis of genes significantly enriched in ECs versus HSPCs. (G) Heatmap displays selected highly expressed TFs in ECs of 52 hpf from the GO analysis. The arrows indicate two genes, atf4 and klf6a, respectively. See also Figure S1. |
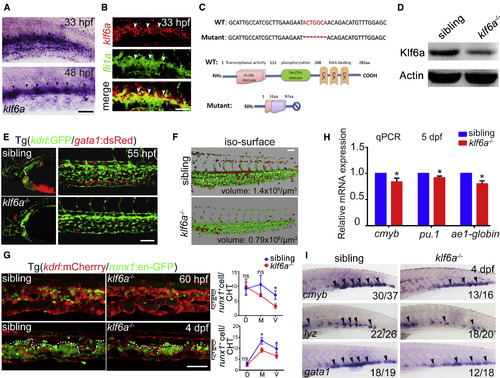
The klf6a-Deficient Embryos Display HSPC Defects in the CHT (A) The high-resolution expression pattern of klf6a in the CHT at 33 hpf and 48 hpf. Black arrowheads indicate the expression of klf6a in caudal venous ECs. Scale bar, 30 μm. (B) Double FISH shows klf6a (red) co-localized with fli1a (green) at 33 hpf in the CHT. White arrowheads indicate the expression of klf6a, fli1a or the co-expression of fli1a and klf6a, respectively. Scale bar, 30 μm. (C) The mutation of klf6a with a 7-bp deletion in genomic DNA and the predicated truncated protein. (D) Western blot result of Klf6a in the siblings and mutants at 48 hpf. (E) Confocal imaging showing kdrl+ vascular deficiency in the CHT and head region, whereas gata1+ cells accumulated in the brain in klf6a−/− embryos in Tg (kdrl:GFP/gata1:dsRed) background. Scale bar, 50 μm. (F) 3D imaging of the CHT vascular structure. Scale bar, 50 μm. (G) Confocal imaging of runx1+ cells and vascular structure in the siblings and klf6a−/− embryos in Tg (kdrl:mCherrry/runx1:en-GPF) background at 60 hpf and 4 dpf (mean ± SD, t test; ∗p < 0.05, ns [not significant] > 0.05, n = 5). Scale bar, 50 μm. (H) The qPCR results of cmyb, pu.1, and ae1-globin expression in siblings and klf6a−/− embryos at 5 dpf (mean ± SD, t test; ∗p < 0.05, n = 3). (I) Expression of cmyb, lyz, and gata1 in siblings and klf6a−/− embryos at 4 dpf by WISH. Black arrowheads indicate the expression pattern of these markers. See also Figure S2. |
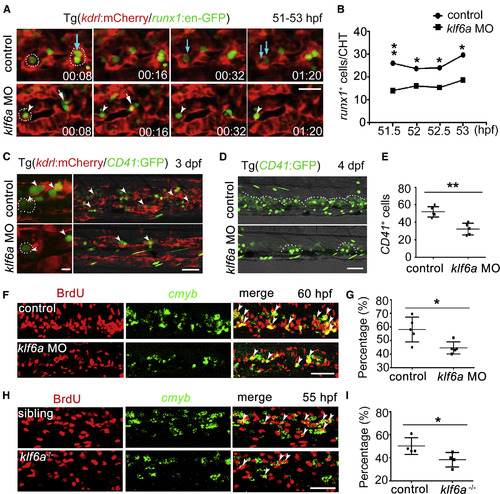
Vascular ECs Are Required for HSPC Lodgment and Proliferation (A) High-resolution confocal imaging of Tg (kdrl:mCherry/runx1:en-GFP) of control and klf6a morphants. White circles mark “cuddling HSPC.” Blue arrows indicate the localization and division of HSPCs associated with the CHT niche in control embryos. White arrows indicate HSPCs that could not seed the perivascular niche and migrated away from ECs in klf6a morphants. White arrowheads mark HSPCs without division in klf6a morphants. Scale bar, 30 μm. (B) Quantification of lodging HSPCs in the CHT in control embryos and klf6a morphants at 51–53 hpf (mean ± SD, t test; ∗p < 0.05, ∗∗p < 0.01, n = 6). (C) Confocal imaging of Tg (kdrl:mCherry/CD41:GFP) at 3 dpf in control embryos and klf6a morphants. The left panel is high-resolution imaging showing dividing HSPCs. White circles mark “cuddling HSPCs.” White arrowheads indicate the HSPCs. Scale bars, 10 μm (left) and 50 μm (right). (D) Confocal imaging showing CD41+ cells in the CHT at 4 dpf. The white dashed lines mark HSPCs and hematopoietic differentiated cells. Scale bar, 50 μm. (E) Quantification of CD41:GFP+ cells shown in (D) in control and klf6a morphants (mean ± SD, t test; ∗∗p < 0.01, n = 5). (F) The imaging of FISH and anti-BrdU staining in control and klf6a morphants at 60 hpf. Red color indicates BrdU signal and green color indicates cmyb expressed cells. White arrowheads indicate the BrdU+/cmyb+ double-positive cells. Scale bar, 50 μm. (G) The statistical data show the percentage of cmyb+BrdU+/cmyb+ cells in (F) (mean ± SD, t test; ∗p < 0.05, n = 5). (H) The imaging of FISH and anti-BrdU staining in sibling and klf6a−/− embryos at 55 hpf. Red color indicates BrdU signal and green color indicates cmyb expressed cells. White arrowheads indicate the BrdU+/cmyb+ double-positive cells. Scale bar, 50 μm. (I) The statistical data show the percentage of cmyb+BrdU+/cmyb+ cells in (H) (mean ± SD, t test; ∗p < 0.05, n = 4). See also Figure S3; Movies S1 and S2. |
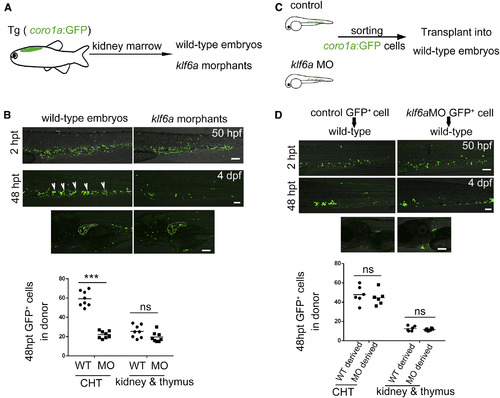
Klf6a Regulates HSPCs in the CHT Non-Cell Autonomously (A) The model of experimental procedure of kidney marrow transplantation. (B) Confocal imaging showing donor-derived coro1a+ cell in recipients 2 hr and 48 hr post transplantation (hpt). The statistical data show that klf6a morphants had fewer donor cells in the CHT, but there was no difference in the thymus and kidney in control and klf6a morphant recipients (mean ± SD, t test; ∗∗∗p < 0.001, ns [not significant] > 0.05, n = 8). White arrowheads indicate the coro1a+ cells. Scale bars, 50 μm. (C) The embryos-to-embryos transplantation model. (D) Transplantation results shows that there was no difference in the number of donor cells from either control or klf6a morphants in the CHT and kidney marrow of wild-type recipients (mean ± SD, t test; ns > 0.05, n = 8). Scale bars, 50 μm. See also Figure S4. |
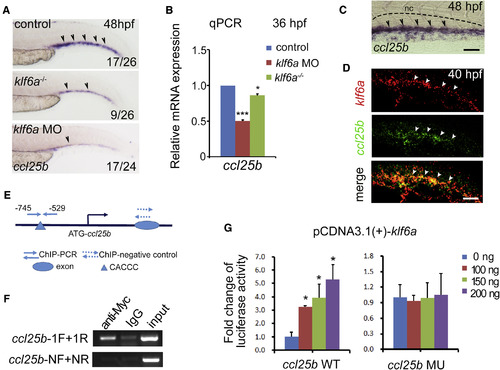
Klf6a Directly Regulates ccl25b Expression (A) Expression of ccl25b in the CHT of control, klf6a morphants, and klf6a−/− embryos at 48 hpf. Black arrowheads mark the ccl25b expressed cells. (B) The qPCR result of ccl25b expression in control, klf6a morphants, and klf6a−/− embryos at 36 hpf (mean ± SD, t test; ∗p < 0.05, ∗∗∗p < 0.001, n = 3). (C) High-magnification imaging of ccl25b expression pattern in the CHT at 48 hpf. Black arrowheads mark the ccl25b expressed cells. The black dashed lines mark the boundary of the caudal artery. Scale bar, 30 μm. (D) Double FISH imaging shows klf6a expression (red), ccl25b expression (green), and co-expression (yellow) in the CHT at 40 hpf. White arrowheads indicate gene expression. Scale bar, 30 μm. (E) The schematic structure of the ccl25b promoter. (F) The ChIP-PCR result shows that Klf6a could directly bind to the promoter of ccl25b. The ccl25b-F/R primers were used to amplify the promoter region containing the conserved Klf6a binding site. The ccl25b-NF/NR were negative control primers used to amplify the ccl25b promoter region without the conserved Klf6a binding site. IgG, immunoglobulin G. (G) Reporter assay shows the regulation of ccl25b promoter by Klf6a. HEK293T cells were co-transfected with the promoter construct of ccl25b containing the conserved Klf6a binding sites (CACCC) or mutated sites (TGTTA) together with the pCDNA3.1(+)-Klf6a plasmid (mean ± SD, t test; ∗p < 0.05, n = 3). See also Figure S5. |
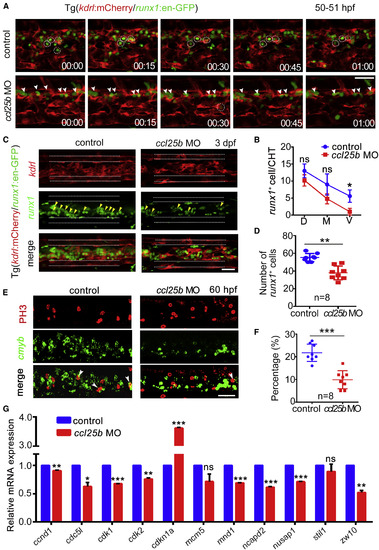
Ccl25b Acts Downstream of Klf6a to Facilitate HSPC Settlement and Expansion (A) Time-lapse imaging of kdrl:mCherry/runx1:en-GFP in control and ccl25b morphants. The white arrowheads mark HSPCs and the white circles indicate HSPC pockets. Scale bar, 50 μm. (B) The statistical data of runx1+ cells in D/M/V of CVP in control and ccl25b morphants at 50 hpf (mean ± SD, t test; ∗p < 0.05, ns [not significant] > 0.05, n = 8). (C) Confocal imaging of kdrl:mCherry/runx1:en-GFP CHT at 3 dpf in control embryos and ccl25b morphants. Yellow arrowheads mark GFP+ cells. The white dashed lines mark the outlines of caudal artery and vein. Scale bar, 50 μm. (D) The quantification of runx1:en-GFP+ cells shown in (C) (mean ± SD, t test; ∗∗p < 0.01, n = 8). (E) Confocal imaging of FISH (cmyb)/immunofluorescence (PH3) at 60 hpf in CHT of control embryos and ccl25b morphants. White arrowheads mark double-positive cells. Scale bar, 50 μm. (F) The statistical data showing that the percentage of double-positive/cmyb+ cells was reduced significantly in the morphants (mean ± SD, t test; ∗∗∗p < 0.001, n = 8). (G) qPCR result of cell division-related gene expression in control and ccl25b morphants (mean ± SD, t test; ∗p < 0.05, ∗∗p < 0.01, ∗∗∗p < 0.001, ns > 0.05, n = 3). See also Figure S6. EXPRESSION / LABELING:
PHENOTYPE:
|
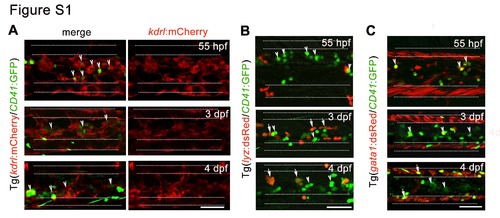
Figure S1. The anatomical relationship between HSPCs and perivascular niche cells. Related to Figure 1. (A) Confocal imaging of Tg (kdrl:mCherry/CD41:GFP) CHT region showing the localization of HSPCs adjacent to vascular ECs. (B-C) Confocal imaging in different transgenic embryos displaying the location of CD41+ cells and hematopoietic cells, including lyz:dsRed+ myeloid cells (B) and gata1:dsRed+ erythroid cells (C) in the CHT. The arrowheads indicate HSPCs and arrows mark differentiated cells derived from HSPCs. The white dashed lines mark the outlines of caudal artery and caudal vein respectively. Scale bar, 50 μm. |
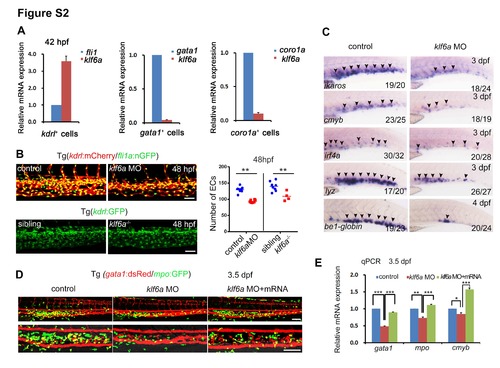
klf6a morphants display the CVP and HSPC defects. Related to Figure 2. (A) The relative expression of klf6a in different cell populations. The kdrl:mCherry+ ECs, gata1:dsRed+ erythroid cells, and coro1a:GFP+ myeloid/lymphoid cells were sorted from transgenic embryos at 42 hpf. (B) Confocal imaging of Tg (kdrl:mCherry/fli1:nGFP) or Tg (kdrl:GFP) in the CHT of control, klf6a morphants and klf6a-/- embryos 48 hpf and the statistical data of the CHT EC number at 48 hpf (mean ± SD, t-test, **P<0.01, ns>0.05). Scale bar, 50 μm. (C) Expression of ikaros, cmyb, irf4a, lyz, and be1-globin at 3 dpf or 4 dpf in control and klf6a morphants. (D) Confocal imaging of the CHT region in control, klf6a morphants and klf6a MO plus klf6a mRNA injected Tg (gata1:dsRed/mpo:GFP) embryos. klf6a morpholino (MO) or klf6a MO plus klf6a mRNA was injected into transgenic embryos. Scale bar, 100 μm. (E) qPCR result of gata1, mpo, and cmyb in control, klf6a morphants and klf6a MO plus klf6a mRNA injected embryos at 3.5 dpf (mean ± SD, t-test, *P<0.05, **P<0.01, ***P<0.001, n = 3). ns, not significant. |
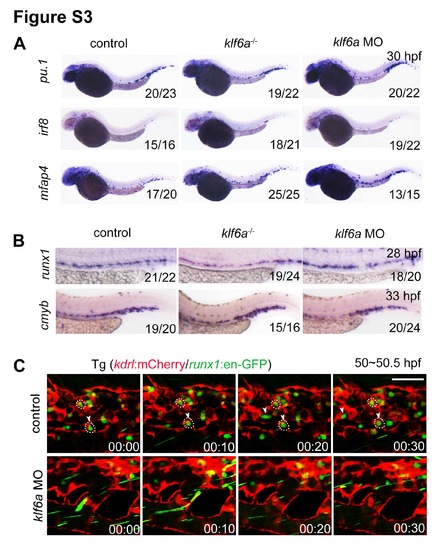
The blockage of HSPCs seeding into the CHT leads to reduced HSPC expansion. Related to Figure 3. (A) Expressions of irf8, pu.1 and mfap4 in control and klf6a deficient embryos at 30 hpf. (B) Expression of runx1 and cmyb in control and klf6a deficient embryos at 28 hpf and 33 hpf. (C) Time-lapse confocal imaging of Tg (kdrl:mCherry/runx1:en-GFP) at 50-50.5 hpf in control and klf6a morphants. The arrowheads showing the HSPC lodgement in the CHT vascular niche. The white circles indicate EC pocket. Scale bar, 50 μm. |
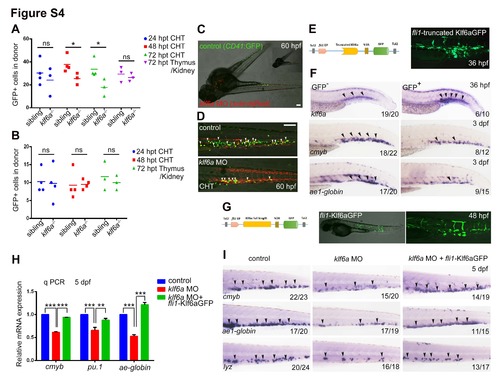
Klf6a mediated HSPCs expansion is specific. Related to Figure 4. (A) The statistical data of the number of coro1a:GFP donor cells derived from wild-type kidney marrow in sibling recipients and klf6a-/- recipients at different post-transplant time points (mean ± SD, t-test, **P<0.01, ns>0.05). (B) The statistical result of the cell number of sibling and klf6a-/- derived 48 hpf coro1a:GFP cells in wild-type recipients at different post-transplant time points (mean ± SD, t-test, ns>0.05). (C) Confocal imaging of parabiotic pairs at 60 hpf. The control embryos were CD41:GFP background and the klf6a morphants were sclα:dsRed background. This image was merged by two pictures of different views. Scale bar, 100 μm. (D) The magnified images of CHT are shown. The HSPCs are indicated by white arrowheads. Scale bar, 100 μm. (E) The schematic diagram showing the construct of truncated Klf6a driven by the fli1 promoter. GFP indicated the expression of truncated protein in fli1+ cells. (F) Expression of klf6a, cmyb and ae1- globin in overexpressed truncated Klf6a (GFP+) embryos or control embryos (GFP-), respectively, at 36 hpf or 3 dpf. (G) The schematic diagram showing the construct of full length Klf6a driven by the fli1 promoter. GFP indicated the expression of Klf6a protein in fli1+ cells. (H) qPCR result of cmyb, pu.1 and ae1-globin expression in control, klf6a morphants and embryos co-injected with fli1-Klf6GFP and klf6a MOs (mean ± SD, t-test, **P<0.01,***P<0.001, n = 3). (I) WISH data of cmyb, lyz and ae1-globin in these three groups. |
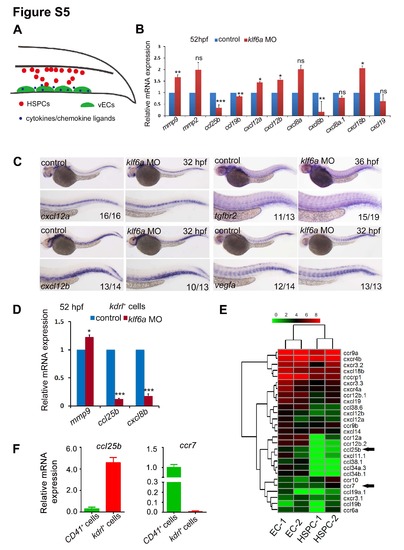
Screening of downstream targets of klf6a in the CHT. Related to Figure 5. (A) The cartoon showing the migration and lodgement process of HSPC in the CHT of zebrafish. (B) qPCR results of chemokine ligands in control and klf6a morphants at 52 dpf. (mean ± SD, t-test, *P<0.05, **P<0.01, ***P<0.001, ns>0.05, n = 3). (C) Expression of cxcl12a, cxcl12b, tgfbr2 and vegfa in control and klf6a morphants. (D) qPCR result of ccl25b, cxcl8b and mmp9 in sorted kdrl+ cells of CHT at 52 dpf (mean ± SD, t-test, *P<0.05, ***P<0.001, n = 3). (E) Heat-map analysis of chemokine ligands and receptors expressed in ECs and HSPCs in the CHT region at 52 hpf. Black arrows indicate chemokine ligand and receptor which is enriched in ECs or HSPCs respectively. (F) qPCR results of ccl25b and ccr7 expression in CD41+ and kdrl+ sorted cells from the CHT at 52 hpf. |
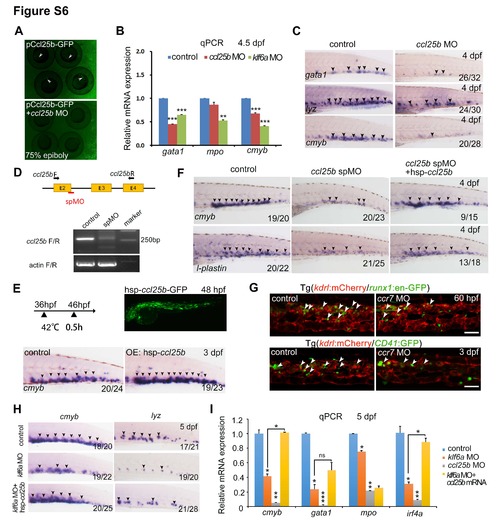
Ccl25b acts as a downstream factor of klf6a in the CHT. Related to Figure 6. (A) The validation of ccl25b ATG MO. (B) Expression of gata1, mpo and cmyb in control, klf6a morphants and ccl25b morphants at 4.5 dpf (mean ± SD, t-test, **P<0.01, ***P<0.001, n = 3). (C) Expression of cmyb, gata1 and lyz in the CHT of control and ccl25b ATG morphants. (D) The ccl25b splice MO was designed to target the boundary of exon2 and intron 2 (red line marks the target region). The primers were used to amplify the exon region for PCR validation of this MO. (E) Overexpression of ccl25b by injection of hsp-ccl25b-GFP plasmid increased cmyb expression in the CHT. The top right panel showing the GFP expression after heat shock. (F) Expression of cmyb and l-plastin in the CHT of control, ccl25b splice MO-injected embryos and ccl25b splice MO plus ccl25b mRNA-injected embryos at 4 dpf. (G) Confocal imaging of Tg (kdrl:mCherry/runx1:en-GFP) and Tg (kdrl:mCherry/CD41:GFP) showing HSPCs in the CHT of control and ccr7 morphants at 60 hpf and 3 dpf. White arrowheads indicate HSPCs. Scale bar, 50 μm. (H) Expression of cmyb and lyz in control embryos, klf6a morphants and klf6a MO plus ccl25b mRNA injected embryos at 5 dpf. (I) qPCR result of cmyb, gata1, mpo and irf4a in both morphants and klf6a MO plus ccl25b mRNA injected embryos (mean ± SD, t-test, *P<0.05, **P<0.01, ***P<0.001, ns>0.05, n = 3). ns, not significant. |
Reprinted from Developmental Cell, 42(4), Xue, Y., Lv, J., Zhang, C., Wang, L., Ma, D., Liu, F., The Vascular Niche Regulates Hematopoietic Stem and Progenitor Cell Lodgment and Expansion via klf6a-ccl25b, 349-362.e4, Copyright (2017) with permission from Elsevier. Full text @ Dev. Cell