
Fig. 3
- ID
- ZDB-FIG-170922-50
- Publication
- Xue et al., 2017 - The Vascular Niche Regulates Hematopoietic Stem and Progenitor Cell Lodgment and Expansion via klf6a-ccl25b
- Other Figures
- All Figure Page
- Back to All Figure Page
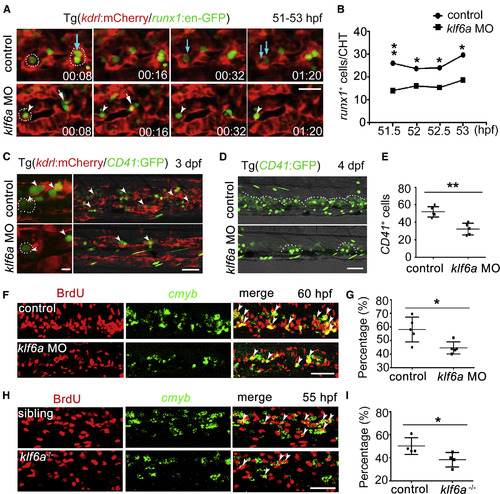
Vascular ECs Are Required for HSPC Lodgment and Proliferation (A) High-resolution confocal imaging of Tg (kdrl:mCherry/runx1:en-GFP) of control and klf6a morphants. White circles mark “cuddling HSPC.” Blue arrows indicate the localization and division of HSPCs associated with the CHT niche in control embryos. White arrows indicate HSPCs that could not seed the perivascular niche and migrated away from ECs in klf6a morphants. White arrowheads mark HSPCs without division in klf6a morphants. Scale bar, 30 μm. (B) Quantification of lodging HSPCs in the CHT in control embryos and klf6a morphants at 51–53 hpf (mean ± SD, t test; ∗p < 0.05, ∗∗p < 0.01, n = 6). (C) Confocal imaging of Tg (kdrl:mCherry/CD41:GFP) at 3 dpf in control embryos and klf6a morphants. The left panel is high-resolution imaging showing dividing HSPCs. White circles mark “cuddling HSPCs.” White arrowheads indicate the HSPCs. Scale bars, 10 μm (left) and 50 μm (right). (D) Confocal imaging showing CD41+ cells in the CHT at 4 dpf. The white dashed lines mark HSPCs and hematopoietic differentiated cells. Scale bar, 50 μm. (E) Quantification of CD41:GFP+ cells shown in (D) in control and klf6a morphants (mean ± SD, t test; ∗∗p < 0.01, n = 5). (F) The imaging of FISH and anti-BrdU staining in control and klf6a morphants at 60 hpf. Red color indicates BrdU signal and green color indicates cmyb expressed cells. White arrowheads indicate the BrdU+/cmyb+ double-positive cells. Scale bar, 50 μm. (G) The statistical data show the percentage of cmyb+BrdU+/cmyb+ cells in (F) (mean ± SD, t test; ∗p < 0.05, n = 5). (H) The imaging of FISH and anti-BrdU staining in sibling and klf6a−/− embryos at 55 hpf. Red color indicates BrdU signal and green color indicates cmyb expressed cells. White arrowheads indicate the BrdU+/cmyb+ double-positive cells. Scale bar, 50 μm. (I) The statistical data show the percentage of cmyb+BrdU+/cmyb+ cells in (H) (mean ± SD, t test; ∗p < 0.05, n = 4). See also Figure S3; Movies S1 and S2. |
| Genes: | |
|---|---|
| Fish: | |
| Knockdown Reagent: | |
| Anatomical Terms: | |
| Stage Range: | Long-pec to Day 4 |
| Fish: | |
|---|---|
| Knockdown Reagent: | |
| Observed In: | |
| Stage Range: | Long-pec to Day 4 |
Reprinted from Developmental Cell, 42(4), Xue, Y., Lv, J., Zhang, C., Wang, L., Ma, D., Liu, F., The Vascular Niche Regulates Hematopoietic Stem and Progenitor Cell Lodgment and Expansion via klf6a-ccl25b, 349-362.e4, Copyright (2017) with permission from Elsevier. Full text @ Dev. Cell