- Title
-
Cell type and tissue specific function of islet genes in zebrafish pancreas development
- Authors
- Wilfinger, A., Arkhipova, V., and Meyer, D.
- Source
- Full text @ Dev. Biol.
|
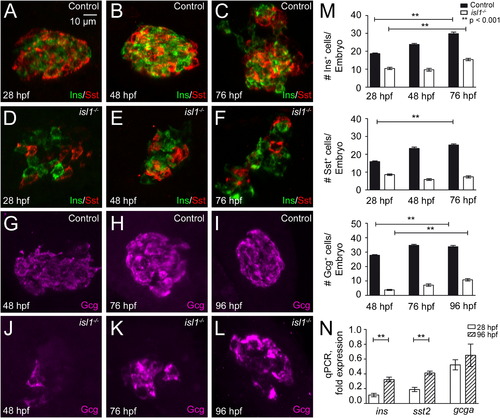
Reduced expression of endocrine hormones in isl1 mutants. (A–F) Confocal image projections of the pancreatic islet in control (A–C) and isl1-/- embryos (D–F) that were co-immunostained for Ins (green) and Sst (red) at 28 hpf (A, D), 48 hpf (B, E) and 76 hpf (C, F). (G–L) Immunostainings for Gcg (purple) in control (G–I) and in isl1-/- embryos (J–L) at 48 hpf (G, J), 76 hpf (H, K) and 96 hpf (I, L). All embryos are shown from ventral with the anterior to the left. (M) Quantitative analysis of hormone expressing cells in control and isl1-/- embryos. Bars show mean+SEM. (N) Relative expression levels of ins, gcga and sst2 mRNA in isl1-/- mutant fish in relation to control littermates as revealed by qPCR analyses of whole embryo RNA preparations, normalized to EF1α. |
|
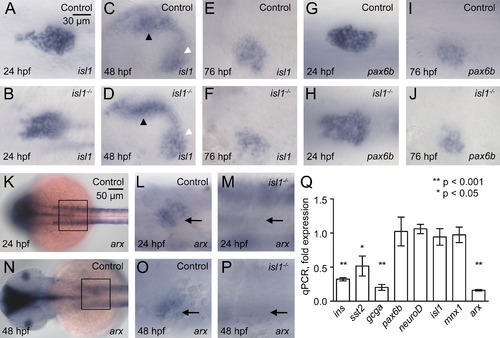
Unchanged expression of early endocrine markers in isl1 mutants. Whole mount in situ hybridizations for isl1 (A–F) and pax6b (G–J) mRNA in control (A, C, E, G, I) and in isl1-/- embryos (B, D, F, H, J) at 24 hpf (A, B, G, H), 48 hpf (C, D) and 76 hpf (E, F, I, J). Note that the pattern and intensity of isl1 signals in the pancreatic mesenchyme (black arrow head) and in the endocrine islet (white arrow head) is indistinguishable in control and mutant embryos. Embryos are shown from ventral with anterior to the left. (K–P) Whole mount in situ hybridizations for arx. (K, N) Dorsal view of control embryos at 24 hpf (K) and 48 hpf (N). Insets mark the position of the pancreatic area shown in higher magnification panels (L M, O, P). Images show a ventral view of control (L, O) and isl1-/- mutant (M, P) embryos. (Q) qPCR analysis for hormone and transcription factor encoding mRNA of isolated pancreata from 96 hpf old embryos. Shown are relative expression levels in pancreata of mutant as compared to control embryos, normalized to the relative expression levels of ins obtained for 96 hpf whole embryonic mRNA. EXPRESSION / LABELING:
|
|
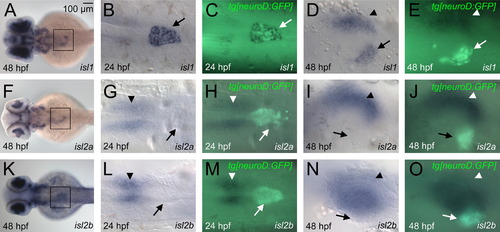
Pancreatic expression of isl1, isl2a and isl2b. Comparison of isl1 (A–E), isl2a (F–J) and isl2b mRNA (K–O) expression at 24 hpf (B, C, G, H, L, M) and 48 hpf (A, D–F, I–K, N, O). Embryos are shown from the dorsal (A, F, K) or ventral view (rest). Insets shown in the overview images (A, F, K) indicate the relative position of the higher resolution images shown on the right side. The mRNA stains were performed in tg[neuroD:GFP] embryos in which immunofluorescence detection of GFP (green signals in C, E, H, J, M, O) was used to highlight endocrine cells (arrows mark the position of the pancreatic islet). Note that only isl1 signals overlap with GFP. Expression of isl2a is found in the mesenchyme anterior the endocrine cells at 24 hpf and left of the GFP labeled endocrine cells at 48 hpf in a pattern overlapping with that of the mesenchymal isl1 expression (arrowheads mark similar position in all embryos). Signals for isl2b are also found anterior to the endocrine cells at 24 hpf (arrowhead) and in a broader mesenchymal domain directly adjacent to the GFP signals at 48 hpf. |
|
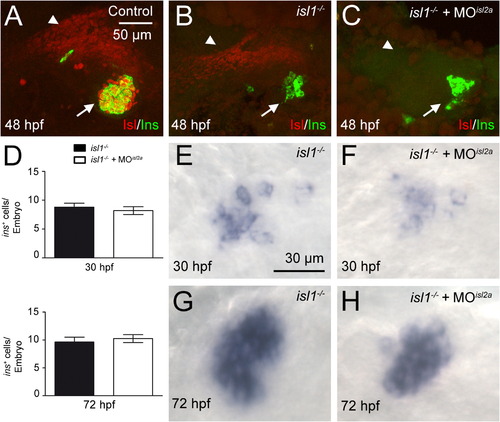
isl2a does not contribute to endocrine cell formation. (A–C) Immunostainings for Ins (green) and Isl-proteins (red) in the pancreatic region of control (A), isl1 mutant (B), and isl1 mutant/MOisl2a injected embryos (C) at 48 hpf. (D) Quantification of ins mRNA positive cells and examples of corresponding in situ stains for ins mRNA in isl1 mutants (E, G), and in isl1 mutant, MOisl2a injected embryos (F, H) at 30 hpf (E, F) and 72 hpf (G, H). Bars show mean+SEM. EXPRESSION / LABELING:
|
|
Formation of pancreatic mesenchyme is independent of isl gene function. Neither the loss of all three isl-genes nor absence of vascularization in cloche mutants results in a loss of fgf10, fgf24 or meis3. Expression patterns of meis3 (A–D), fgf10 (E–H) and fgf24 (I–L) in pancreatic mesenchyme of control embryos (B, F, J), isl1/2a/2b depleted embryos (C, G, K) and cloche mutants (D, H, L). All images are ventral with the exception of A, E, I which are dorsal views. Anterior is to the left. Insets in A, E, I mark the position of the higher resolution images shown on the right side. EXPRESSION / LABELING:
|
|
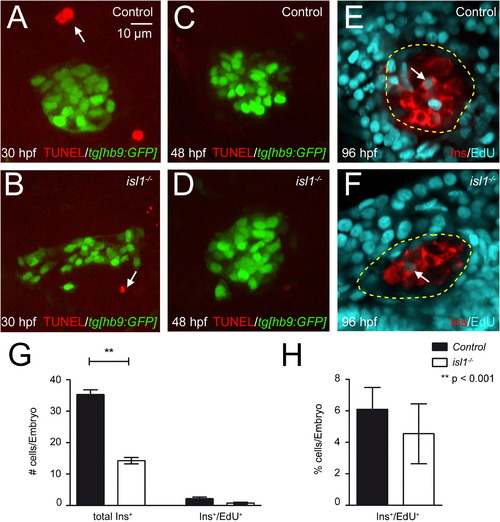
TUNEL and EdU assays on control and mutant embryos. (A–D) Confocal image projections of 30 hpf (A+B) and 48 hpf (C+D) old control and isl1 mutant embryos in the tg[hb9:GFP] background after TUNEL labeling for apoptotic cells. The arrow highlights individual TUNEL+ cells in the vicinity of the GFP labeled islet. No TUNEL+ cells were found within the pancreatic islet of control or mutant fish at all analyzed stages. (E+F) Confocal sections of 96 hpf embryos labeled for Ins (in red) and EdU (in blue). Embryos were treated with EdU from 48 hpf to 96 hpf. Note that very few EdU+ cell are present within the islet (highlighted by yellow circle), while most of the nuclei in the surrounding exocrine tissue are EdU-positive. All images show ventral view, anterior to the left. (G) Numbers of Ins+ and Ins+/EdU+ cells in control and isl1 mutants. (H) Percentage of EdU+/Ins+ cells in relation to the number of Ins+ cells. Bars show mean+SEM. |
|
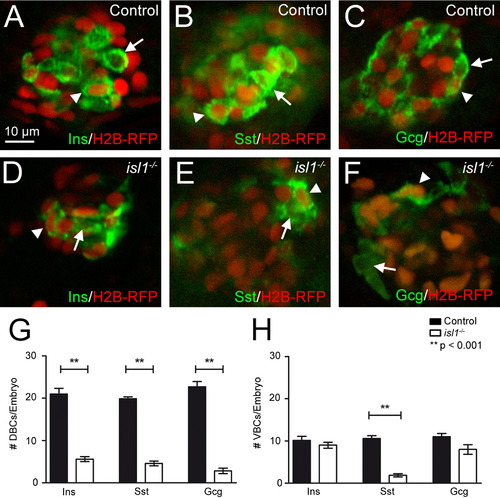
Endocrine hormone expression in first and second wave endocrine cells in control and isl1 mutant embryos. Single plane views from confocal images of the primary islets from control (A–C) and isl1 mutants (D–E). Embyros were injected with H2B-RFP (in red) encoding mRNA at the one cell stage and were immunostained (in green) for Ins (A, D), Sst (B, E) and Gcg (C, F) at 96 hpf. Cells that left cell-cycle early in development show a red nuclear label due to the injecetion of H2B-RFP encoding mRNA at the one cell stage. Arrowheads indicate examples of hormone+/RFP+ cells (refered to as DBCs), while arrows indicates examples of hormone+/RFP- cells (referred to as VBCs). (G, H) Quantification of hormone+ DBCs (G) and VBCs (H) in control (black bars) and isl1 mutant embryos (white bars). Note that isl1 mutants show significantly reduced numbers for all DBCs, while only the number of Sst expressing VBCs cells is significantly reduced. Bars show mean+SEM. |
|
Phenotype of isl1 mutant zebrafish compared to wildtype. Images of live control embryos (A–E) and isl1 mutant embryos (F–J) taken between 24–120 hpf. (F–J) Mutant embryos appear normal during the first two days after fertilization but show heart edema at 72 hpf (black arrow head in H, I and J). At later stages, the isl1 mutant fish show various defects including smaller eyes, malformed somites and a non-inflated swim bladder (sb). |
|
Expression of ins, sst and gcg mRNA in control and isl1 mutants mRNA expression of ins (A–F), sst (G–L) and gcg (M–R) in the pancreatic islets of control embryos and isl1 mutants at the indicated stages. Note that in mutants the expression of ins and sst is strongly reduced at all stages analyzed, while glu is virtually absent at 52 hpf and strongly reduced at older stages. Images show a dorsal view with anterior to the left. |
|
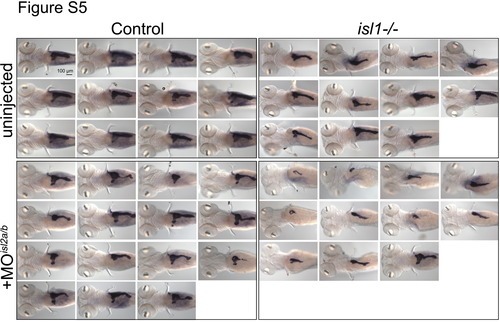
Dosedependent reduction of trypsin expression following genetic and morpholino-based loss of isl gene function at 76 hpf. Examples of trypsin mRNA stainings that were summarized in Fig. 5C. Shown are control (A–D) and isl1 mutant embryos (E–H) that were injected with indicated combinations of isl2a and isl2b morpholinos. Images show a dorsal view with anterior to the left. (I) Quantification of the length of trypsin mRNA expression in control and isl1 mutant embryos injected with the indicated morpholinos. Bars show mean+SEM. |
|
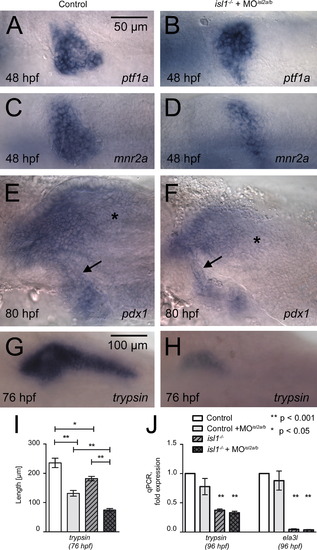
Trypsin mRNA expression following genetic and morpholino-based loss of isl gene function at 96 hpf. Note that isl1 mutants and isl2a/2b double morphants display similar trypsin pattern. |
|
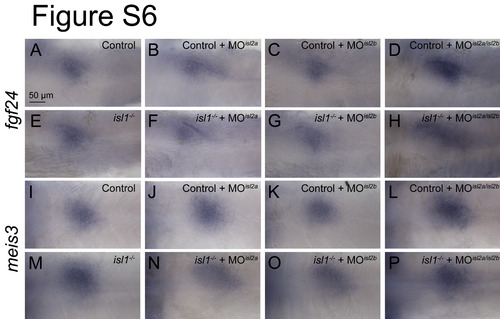
Pancreatic mesenchyme in control and isl1 mutant/ isl2a & isl2b morphant embryos (48 hpf). Expression pattern of mesenchymal fgf24 (A–H) and meis3 (I–P). Single or multiple loss of isl genes has no impact on the mRNA expression pattern. Images show a ventral view with anterior to the left. |
Reprinted from Developmental Biology, 378(1), Wilfinger, A., Arkhipova, V., and Meyer, D., Cell type and tissue specific function of islet genes in zebrafish pancreas development, 25-37, Copyright (2013) with permission from Elsevier. Full text @ Dev. Biol.

