- Title
-
The knockdown of maternal glucocorticoid receptor mRNA alters embryo development in zebrafish
- Authors
- Pikulkaew, S., Benato, F., Celeghin, A., Zucal, C., Skobo, T., Colombo, L., and Dalla Valle , L.
- Source
- Full text @ Dev. Dyn.
|
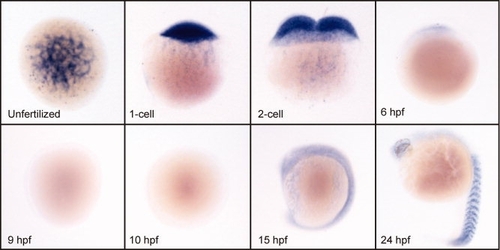
Spatio-temporal expression of gr mRNA during zebrafish development evidenced by whole-mount in situ hybridization performed at the indicated stages. All embryos are lateral views with the animal pole up (1- and 2-cell embryos and at 6, 9, and 10 hpf) and head up pointing to the left (15 and 24 hpf). Note that expression levels of gr mRNA are lost at 9 and 10 hpf and again detected at 15 hpf. |
|
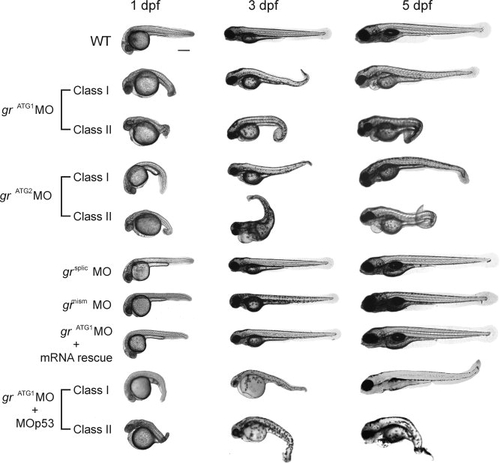
Phenotypes of embryos or larvae at 1, 3, and 5 dpf after treatment with grATG1MO alone or together with MOp53 as compared to control groups (WT or treated with grmismMO or grsplicMO) or after rescuing with t-gr2 mRNA. Fish in Class II are more severely affected than in Class I. Animals are presented as lateral view, anterior to the left. Bar = 500 µm. The effects of grATG2MO are also shown. |
|
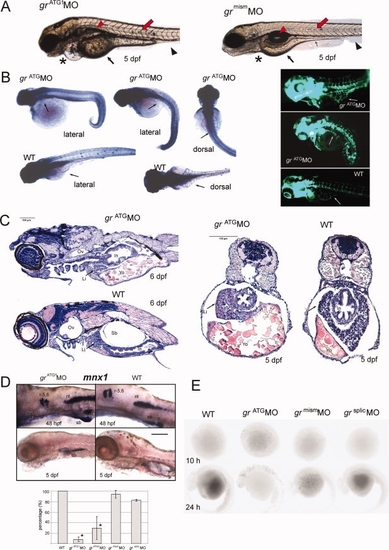
A:grATG1MO-injected embryos failed to inflate the swim bladder (red arrowhead) and displayed a voluminous yolk sac and yolk extension (small arrow), pericardial oedema (asterisk), disrupted myoseptal melanophores (red arrow), and less developed trunk fin (black arrowhead) compared with grmismMO control at 5 dpf. B: Left: alkaline phosphatase staining showing reduced or absent sub-intestinal veins (SIV, arrow) in grATGMO embryos as compared to well-organized SIV in WT embryos at 3 dpf; results were the same using the Tg(fli1a:EGFP)y1 zebrafish transgenic line (right). C: Histology of zebrafish grATG1MO and WT embryos at 6 (sagital sections) and 5 (trasversal sections) dpf. Ov, otic vesicle; Li, liver; In, intestine; Yo, yolk sac; Sb, swim bladder. D: Top: expression of mnx1 in grATG1MO and WT embryos as detected by WISH. Lateral view shows mnx1 expression in the swim bladder epithelium (sb) at 48 hpf and 5 dpf. Other domains of expression are rhombomeres 5 and 6 (r-5,6), neural tube (nt), and endocrine pancreas (p). Bottom: Effects of grATG1MO and grATG2MO, grmismMO, and grsplicMO on swim bladder inflation in larvae at 5 dpf. Results show the percentage average (means ± SD) of individual larvae (n = 20; in triplicate) that developed the gas bladder. Means with asterisks indicate statistically significant differences from controls (P < 0.05). E: TUNEL analysis to detect apoptotic nuclei in WT, grATG1MO grmismMO and grsplicMO embryos at 10 and 24 hpf. |
|
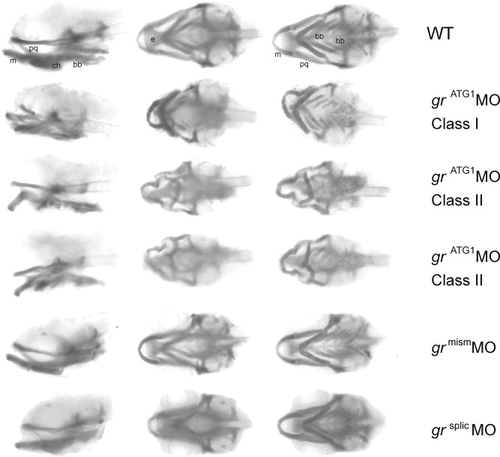
Alcian blue staining of zebrafish WT and MO-injected embryos at 6 dpf (except grmismMO and grsplicMO that were analyzed at 5 dpf) showing alterations of the cartilaginous structures in grATGMO morphants. Malformations are of greater severity in class II than class I embryos. Right, middle, and left images: lateral, dorsal, and ventral views, respectively. M, Meckel′s cartilage; pq, palatoquadrate; ch, ceratohyal; bb, basibranchial; e, ethmoid plate; hb, hypobranchial. |
|
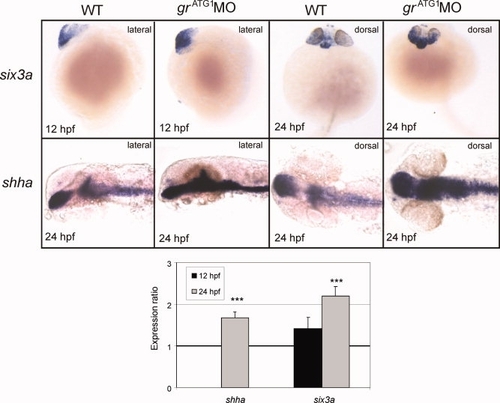
WMISH showing expression of the developmental markers, six3a and shha, in WT and grATG1MO-injected embryos at 12 and/or 24 hpf. Below: Fold changes in gene expression in grATG MO-injected embryos compared to WT (set at 1). Values represent the mean ± S.E. (n = 3). ***P < 0.001, differences in expression levels are significantly different. EXPRESSION / LABELING:
PHENOTYPE:
|
|
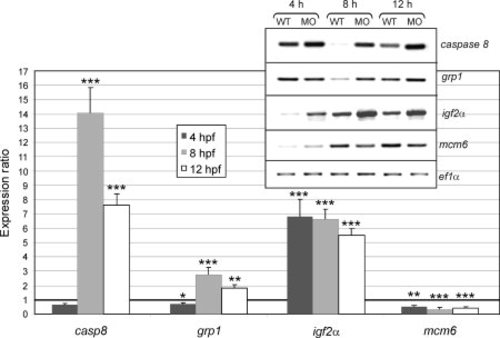
Fold changes in gene expression of caspase 8, grp1, igf2α, mcm6 in grATG1MO-injected embryos compared to WT (set at 1). Values represent the mean ± S.E. (n = 3). Asterisks indicate that expression levels are significantly different: *P < 0.05; **P < 0.01; ***P < 0.001. The inset shows the RT-PCR results as visualized by agarose gel. EXPRESSION / LABELING:
|
|
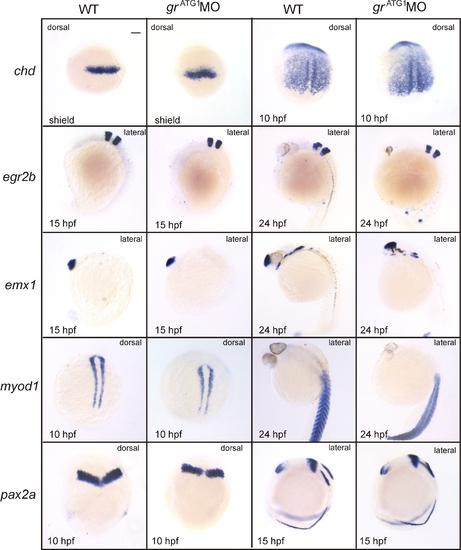
Supp. Fig. S1. WMISH showing expression of the developmental markers, chd, egr2b, emx1, myod1, and pax2a, in WT and grATG1 MO-injected embryos at different developmental stages. |

