
IMAGE
Fig. 3
- ID
- ZDB-IMAGE-110322-31
- Publication
- Pikulkaew et al., 2011 - The knockdown of maternal glucocorticoid receptor mRNA alters embryo development in zebrafish
- All Figures
- Figures for Pikulkaew et al., 2011
Image
|
Figure Caption
Fig. 3
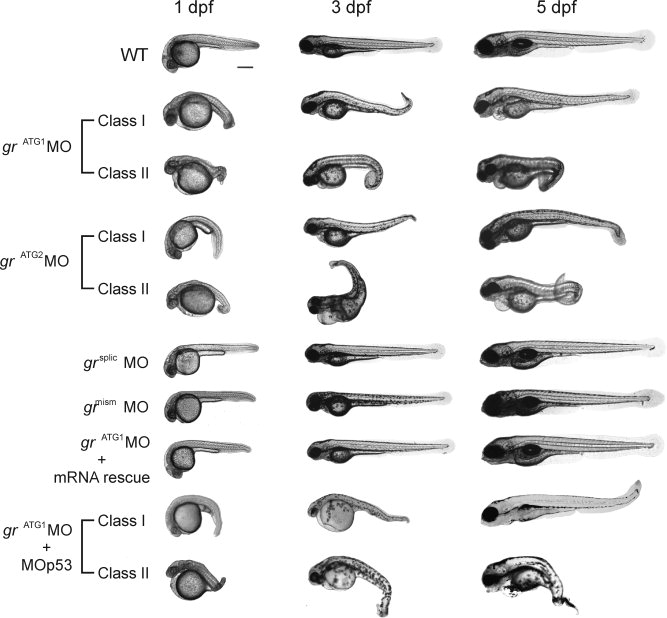
Phenotypes of embryos or larvae at 1, 3, and 5 dpf after treatment with grATG1MO alone or together with MOp53 as compared to control groups (WT or treated with grmismMO or grsplicMO) or after rescuing with t-gr2 mRNA. Fish in Class II are more severely affected than in Class I. Animals are presented as lateral view, anterior to the left. Bar = 500 µm. The effects of grATG2MO are also shown.
Figure Data
Acknowledgments
This image is the copyrighted work of the attributed author or publisher, and
ZFIN has permission only to display this image to its users.
Additional permissions should be obtained from the applicable author or publisher of the image.
Full text @ Dev. Dyn.