
IMAGE
Fig. 7
- ID
- ZDB-IMAGE-161020-33
- Genes
- Publication
- Pikulkaew et al., 2011 - The knockdown of maternal glucocorticoid receptor mRNA alters embryo development in zebrafish
- All Figures
- Figures for Pikulkaew et al., 2011
Image
|
Figure Caption
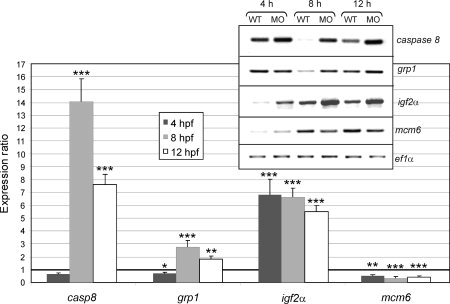
Fig. 7
Fold changes in gene expression of caspase 8, grp1, igf2α, mcm6 in grATG1MO-injected embryos compared to WT (set at 1). Values represent the mean ± S.E. (n = 3). Asterisks indicate that expression levels are significantly different: *P < 0.05; **P < 0.01; ***P < 0.001. The inset shows the RT-PCR results as visualized by agarose gel.
Figure Data
Acknowledgments
This image is the copyrighted work of the attributed author or publisher, and
ZFIN has permission only to display this image to its users.
Additional permissions should be obtained from the applicable author or publisher of the image.
Full text @ Dev. Dyn.