- Title
-
Calcium fluxes in dorsal forerunner cells antagonize {beta}-catenin and alter left-right patterning
- Authors
- Schneider, I., Houston, D.W., Rebagliati, M.R., and Slusarski, D.C.
- Source
- Full text @ Development
|
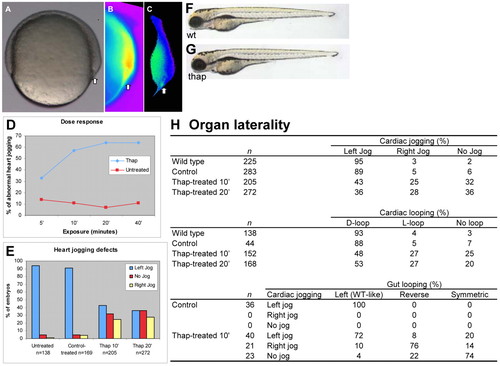
Ca2+ manipulation impacts organ laterality. (A-C) Lateral view, dorsal to the right of 70-80% epiboly stage embryos with arrows indicating the DFC region in (A) bright field image, (B) an individual frame of Fura-2 (380) fluorescence and (C) the corresponding ratiometric image (340/380). The ratio image is converted to pseudo-color with yellow indicating high free intracellular Ca2+. (D) Summary plot of thapsigargin exposure vs heart jogging defects. (E) Summary of heart jogging defects in wt, control and after 10 and 20 minutes of thapsigargin treatment at 60% epiboly. Lateral view of wt (F) and thapsigargin-treated (G) embryos. (H) Summary of organ laterality defects. Thap, thapsigargin. |
|
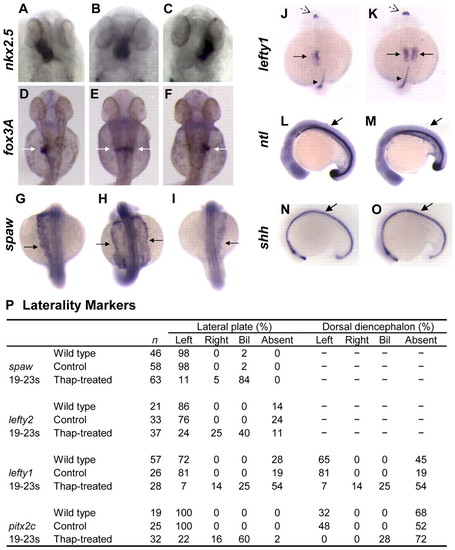
Thapsigargin treatment disrupts organ laterality and molecular asymmetry. (A-C) Dorsal view, 30 hpf, showing nkx2.5 expression in the heart tube, denoting a left jog in wt (A), and no jog (B) or right jog (C) in thapsigargin-treated embryos. (D-F) Dorsal view, 48 hpf, white arrows indicate foxA3 gut expression in wt (D) and symmetrical (E) or reverse loop (F) in thapsigargin-treated embryos. (G-I) Dorsal view, 19-23 somites, arrows indicate left-sided spaw expression in (G) wt, and (H) bilateral or (I) right-sided expression in thapsigargin-treated. Dorsal view, 19-23 somites, arrows indicate LPM, dashed arrows indicate brain lefty1 expression on the left side in (J) wt, and (K) bilateral in thapsigargin-treated, arrowheads denote lefty1 expression in the midline. Lateral view of ntl expression in (L) wt and (M) thapsigargin-treated, and shh expression in (N) wt and (O) thapsigargin-treated embryos. (P) Summary of asymmetrical marker expression. EXPRESSION / LABELING:
|
|
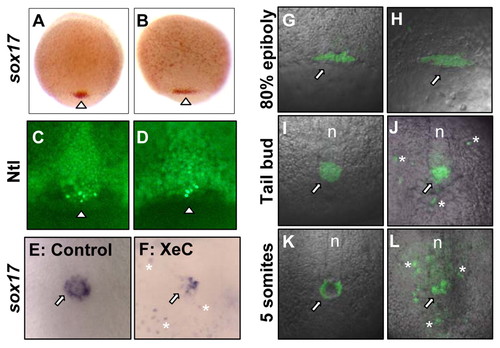
The DFCs are specified and migrate to the tailbud in thapsigargin-treated embryos. sox17 expression at 80% epiboly in (A) wt and (B) thapsigargin-treated embryos. Enriched Ntl protein at 80% epiboly in the DFCs in (C) wt and (D) thapsigargin-treated embryos; arrowheads note the DFC region. Expression of sox17 at 4-5 somites in (E) wt and (F) XeC-treated embryos; asterisks indicate dispersed cells, arrows indicate DFC/KV region. Tg (Dusp6:d2EGFP) expression at 80% epiboly in (G) untreated and (H) thapsigargin-treated embryos; arrows indicate DFCs. EGFP expression at tailbud to 1-somite in (I) untreated and (J) thapsigargin-treated embryos and at 5 somites in (K) untreated and (L) thapsigargin-treated embryos. XeC, Xestospongin C; n, notochord. EXPRESSION / LABELING:
|
|
DFC regional Ca2+ is required for KV morphogenesis. (A) Summary of KV defects. (B-D) Bright field image of wt embryo with normal KV (B) and thapsigargin-treated with reduced (C) and absent (D) KV: dorsal view, 10 somites. Arrows indicate vesicle location; n, notochord. (E-G) charon expression (arrows) around KV in wt (E) and thapsigargin-treated embryos with reduced (F) and absent (G) signal: lateral view, 10 somites. Insets show dorsal view of charon expression. Thap, thapsigargin. Scale bars: 50 μm. EXPRESSION / LABELING:
|
|
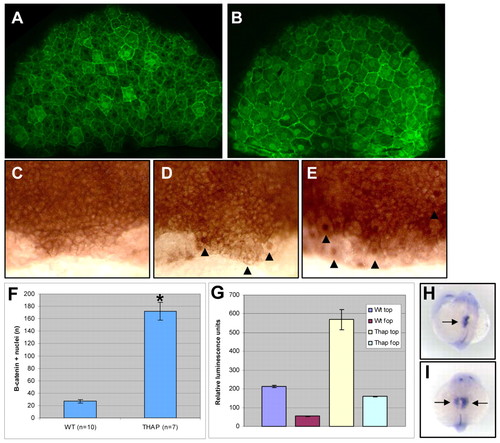
Ca2+ inhibition activates β-catenin and β-catenin is sufficient to alter laterality. Confocal images of β-catenin immunolocalization at 70-80% epiboly in (A) wt and (B) thapsigargin-treated embryos. HRP staining of β-catenin protein oriented on the DFC region in (C) wt, (D) thapsigargin-treated and (E) DFC-targeted Axin-1 MO-injected embryos; arrowheads indicate β-catenin-positive nuclei. (F) Comparison of total nuclear β-catenin in wt and thapsigargin-treated embryos.* indicates P-value of 2.5x10⁻⁵. (G) TopFlash (top) vs. FopFlash (fop) luciferase reporter constructs analyzed for relative luminescence in wt or thapsigargin-treated embryos, normalized to control (Renilla) luciferase. Data are means ± s.e. (H,I) Combined lefty1 and lefty2 expression (arrows) in the left LPM and brain in wt (H) and bilateral (I) in DFC-targeted β-catenin RNA-injected embryos: dorsal-anterior view, 19-23 somites. EXPRESSION / LABELING:
|
|
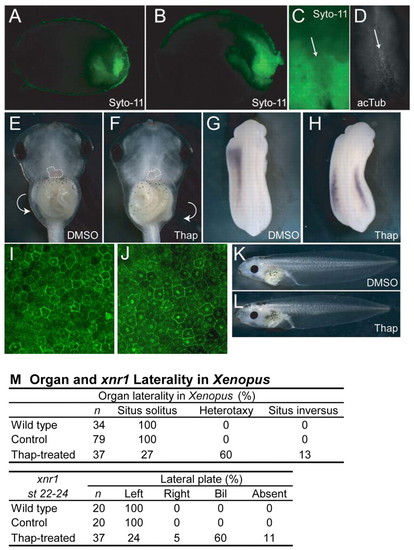
Xenopus DFC-like cells and Ca2+ requirement for laterality. Xenopus embryos incubated with Syto-11 at stage 11.5 and sagittally bisected at (A) stage 14 and (B) stage 17 showing Syto-11-labeled cells enriched in the future tail region. (C) Stage 17 archenteron roof explant, showing Syto-11 staining of the node (arrow) and surrounding LPM. (D) Explant in C immunostained for acetylated tubulin (acTub), which is enriched in the node region (arrow). (E) Ventral view of stage 46 control-treated embryo, showing situs solitus, or normal lateral asymmetry. The heart is outlined, showing the left-sided position of the ventricle and right-sided outflow tract. The gut coils counterclockwise, as shown by the arrow. (F) Ventral view of a thapsigargin-treated embryo at stage 46, showing an example of situs inversus, or reversed laterality. The heart is outlined, showing the right-sided position of the ventricle and left-sided outflow tract. The gut coils clockwise, as shown by the arrow. (G) Left-sided xnr1 expression at stage 22-24 in a DMSO-treated embryo. (H) Bilateral xnr1 expression in a thapsigargin-treated embryo. (I,J) Lateral view of β-catenin protein localization in control-treated (I) and thapsigargin-treated (J) stage 13 embryos. Note increased number and intensity of nuclear staining. (K,L) Lateral views of control (K) and thapsigargin-treated (L) embryos, showing normal axial development. (M) Summary of Xenopus laterality data. Thap, thapsigargin. |
|
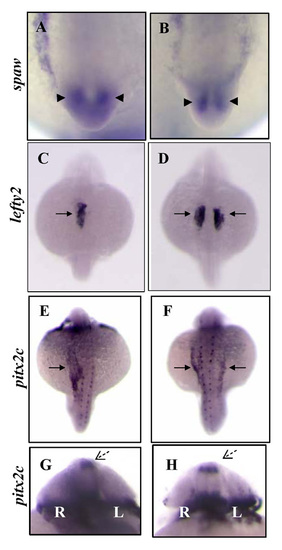
Thapsigargin treatment impacts asymmetric gene expression. Arrowheads denote bilateral domain of spaw expression in the tailbud of (A) wt and (B) treated embryos. Arrows denote left-sided lefty2 expression in (C) wt and (D) bilateral in treated embryos. Arrows denote left-sided pitx2c expression in (E) wt and (F) bilateral in treated. Dotted arrows denote left-sided pitx2c expression in the brain of (G) wt and (H) bilateral in treated. EXPRESSION / LABELING:
|
|
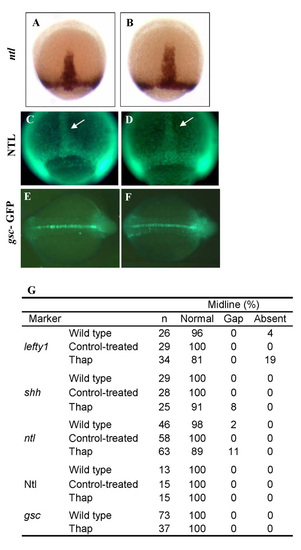
Thapsigargin treatment impacts organ laterality without disrupting midline integrity. ntl RNA expression in (A) wt and (B) treated embryos. Ntl protein expression in (C) wt and (D) treated. goosecoid (gsc)-GFP in (E) wt and (F) treated embryos. (G) Summary of midline expression of lefty1, shh, ntl, Ntl, and gsc in wt, control and thapsigargin-treated embryos. Thap, thapsigargin. EXPRESSION / LABELING:
|
|
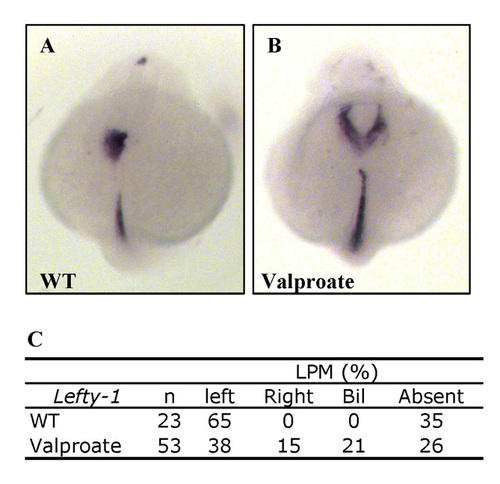
Valproate treatment results in LR patterning defects. Left-sided lefty1 expression in (A) wt and (B) bilateral in valproate-treated embryos. (C) Summary of lefty1 LPM expression after exposure to valproate. EXPRESSION / LABELING:
|
|
Molecular marker evaluation of DFC migration/cohesion and Syto-11 uptake after thapsigargin treatment. Arrowheads denote lrdr1 expression 80% epiboly in the DFC region in (A) wt and (B) thapsigargin-treated embryos. lrdr1 expression at 4-somite stage in the KV region in (C) wt and in (D) thapsigargin-treated embryos. sox17 expression at 4-somite stage in the KV region in (E) wt and in (F) thapsigargin-treated embryos. Syto-11 fluorescence at 17-somite stage in the tail bud region in (G) wt and in (H) thapsigargin-treated embryos. Acetylated tubulin (acTub) immunostaining denotes cilia at 10-somite stage in the KV region in (I) wt and in (J) thapsigargin-treated embryos. (K) Summary of DFC distribution. Thap, thapsigargin. EXPRESSION / LABELING:
|
|
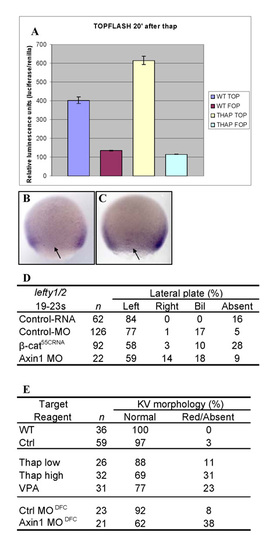
Increased β-catenin reporter activity after thapsigargin treatment. (A) TopFlash (top) vs FopFlash (fop) luciferase reporter constructs analyzed for relative luminescence in wt or thap-treated embryos 20 minutes after treatment, normalized to renilla luciferase. TOPdGFP reporter transgenic line, WMISH with GFP probe, dorsal side shown, GFP expression is excluded from DFC region in (B) wt, but detected in (C) thapsigargin-treated embryos. Typical lateral domains of TOPdGFP reporter expression are present in both untreated and treated embryos. Arrows note DFC region. (D) Summary of lefty1/2 expression in DFC-targeted embryos. Axin1-MO injected had a P value <0.01 by Chi-square analysis. (E) Summary table of KV alterations of DFC-targeted MOs and Ca2+/ PI cycle inhibitors. Thap, thapsigargin; WT, wild type; Ctrl, control DMSO; Thap low, low concentration; Thap high, high concentration; VPA, valproate. |
|
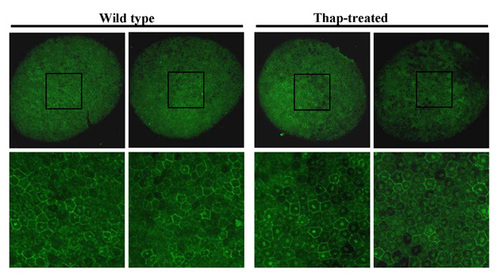
Thapsigargin treatment in Xenopus results in increased nuclear β-catenin. Confocal images of both sides of wild-type and thapsigargin-treated embryos at stage 17, showing β-catenin immunostaining. Black boxes on top panels are enlarged in bottom panels to show nuclear β-catenin in wild-type and treated embryos. Thap, thapsigargin. |

