|
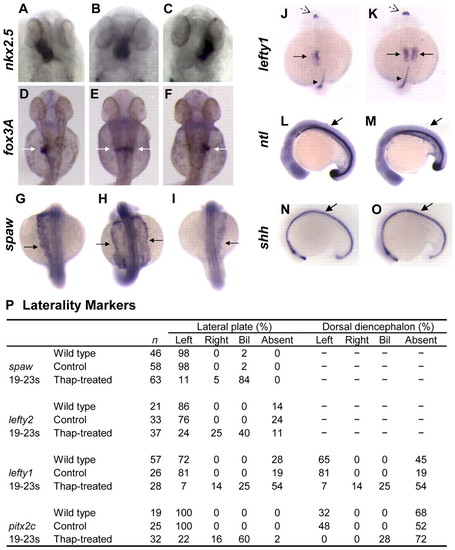
Thapsigargin treatment disrupts organ laterality and molecular asymmetry. (A-C) Dorsal view, 30 hpf, showing nkx2.5 expression in the heart tube, denoting a left jog in wt (A), and no jog (B) or right jog (C) in thapsigargin-treated embryos. (D-F) Dorsal view, 48 hpf, white arrows indicate foxA3 gut expression in wt (D) and symmetrical (E) or reverse loop (F) in thapsigargin-treated embryos. (G-I) Dorsal view, 19-23 somites, arrows indicate left-sided spaw expression in (G) wt, and (H) bilateral or (I) right-sided expression in thapsigargin-treated. Dorsal view, 19-23 somites, arrows indicate LPM, dashed arrows indicate brain lefty1 expression on the left side in (J) wt, and (K) bilateral in thapsigargin-treated, arrowheads denote lefty1 expression in the midline. Lateral view of ntl expression in (L) wt and (M) thapsigargin-treated, and shh expression in (N) wt and (O) thapsigargin-treated embryos. (P) Summary of asymmetrical marker expression.
|