
- Title
-
Metabolic Regulation of Inflammasome Activity Controls Embryonic Hematopoietic Stem and Progenitor Cell Production
- Authors
- Frame, J.M., Kubaczka, C., Long, T.L., Esain, V., Soto, R.A., Hachimi, M., Jing, R., Shwartz, A., Goessling, W., Daley, G.Q., North, T.E.
- Source
- Full text @ Dev. Cell

ZFIN is incorporating published figure images and captions as part of an ongoing project. Figures from some publications have not yet been curated, or are not available for display because of copyright restrictions. EXPRESSION / LABELING:
|
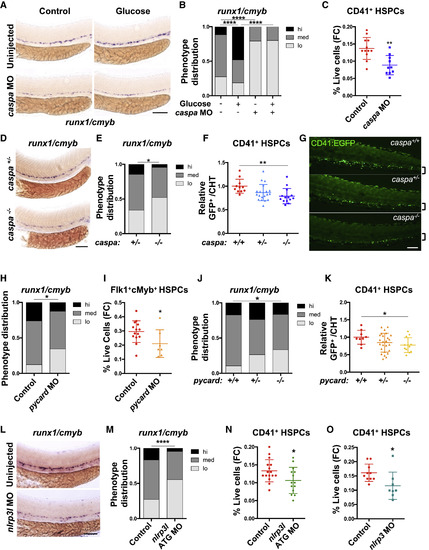
Inflammasome Action Regulates HSPC Formation (A) Expression of runx1/cmyb in embryos with or without morpholino (MO)-mediated caspa knockdown or 1% glucose treatment (12–36 hpf) assessed by WISH. (B) Phenotypic distribution plot of runx1/cmyb expression scored in embryos from (A) (n ≥ 50 /condition). (C) caspa knockdown reduces the frequency of CD41:EGFP+ HSPCs by flow cytometry (FC) at 48 hpf. (D) runx1/cmyb WISH in caspa+/− and caspa−/− embryos at 36 hpf. (E) Phenotypic distribution plot of runx1/cmyb expression scored in embryos from (D) (n ≥ 46 /condition). (F) CD41:EGFP+ HSPCs in the CHT of embryos from caspa+/− incrosses at 48 hpf. Counts normalized relative to caspa+/+ embryos for each clutch. Significance determined by Tukey’s multiple comparison test. (G) Representative in vivo images of CD41+ HSPCs in the CHT region (brackets) in embryos from (F). (H) pycard knockdown reduces runx1/cmyb expression by WISH (36 hpf; n ≥ 32 / condition). (I) pycard knockdown decreases the frequency of HSPCs in Tg(flk1:dsRed;cmyb:egfp) embryos by flow cytometry (48 hpf). (J) runx1/cmyb WISH in pycard−/− embryos compared with stage-matched pycard+/+ and pycard+/− embryos (n ≥ 29/condition). (K) CD41+ HSPCs in the CHT of embryos from pycard+/− incrosses. Counts were normalized relative to pycard+/+ embryos for each clutch. Significance was determined by Fisher’s LSD test. (L) runx1/cmyb expression in the aorta with or without nlrp3l knockdown. (M) Phenotypic distribution plot of embryo cohorts from (L) (n ≥ 85/condition). (N) nlrp3l knockdown decreases the frequency of HSPCs assayed by flow cytometry at 48 hpf. (O) nlrp3 knockdown reduces the frequency of CD41+ HSPCs at 48 hpf. ∗p < 0.05, ∗∗p < 0.01, ∗∗∗p < 0.001, ∗∗∗∗p < 0.0001. Scale bars, 100 μm. Error bars indicate SD. See also Figure S2. |
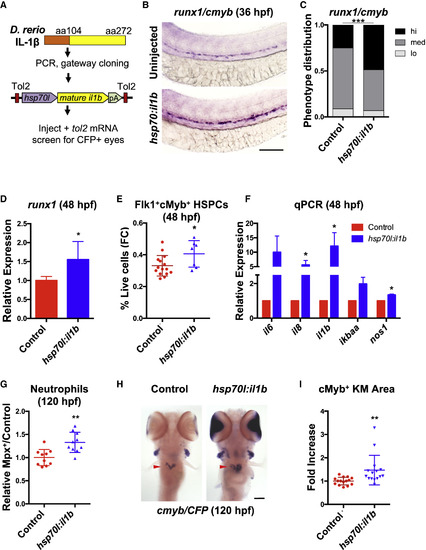
IL1β Mediates HSPC Production (A) Generation of Tg(hsp70l:il1b) embryos. (B) runx1/cmyb expression (36 hpf) in the dorsal aorta with or without il1b overexpression (actIL1β; 32 hpf) in chimeric injected embryos. (C) Phenotype distribution plot of runx1/cmyb expression scored in embryos from (B) (n ≥ 117/condition). (D) actIL1β induces runx1 in whole Tg(hsp70l:il1b) embryos by qPCR (48 hpf, n = 5, mean ± SEM). (E) HSPCs quantified by flow cytometry (FC) in Tg(flk1:dsRed;cmyb:GFP;hsp70l:il1b) embryos compared with actIL1β− controls (48 hpf). Error bars indicate SD. (F) actIL1β (32 hpf) induces expression of il1b and common targets (n ≥ 3, 48 hpf, mean ± SEM). (G) Relative frequency of neutrophils in 120 hpf Tg(mpx:GFP;hsp70l:il1b) embryos heat-shocked at 32 hpf. Error bars indicate SD. (H) WISH images of cmyb expression in the kidney marrow (arrows) at 120 hpf, after actIL1β induction at 32 hpf. CFP eye signal was used to identify the presence of the hsp70l:il1b transgene. (I) Quantification of kidney marrow area in embryos from (H). Error bars indicate SD. Scale bars, 100 μm. ∗p < 0.05, ∗∗p < 0.01. See also Figure S3. |
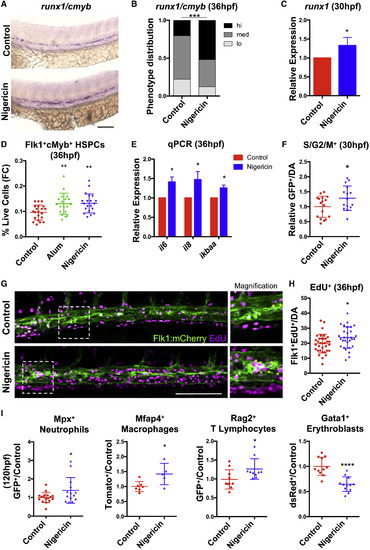
HSPC Production Is Enhanced by Inflammasome Activation (A) Expression of runx1/cmyb in the dorsal aorta of embryos with or without inflammasome stimulation (12–36 hpf) assessed by WISH. (B) Phenotype distribution plot of runx1/cmyb expression scored in embryos from (A) (n ≥ 59/condition). (C) runx1 qPCR in embryos with or without inflammasome stimulation (n = 4, mean ±SEM). (D) Nigericin or Alum (12–36hpf) increased HSPCs by flow cytometry (FC). Significance was determined by ANOVA with Dunnett’s post-hoc test. Error bars indicate SD. (E) qPCR of IL1β target genes in embryos with or without inflammasome stimulation (n = 6, mean ± SEM). (F) Relative numbers of S/G2/M+ cells in Tg(EF1a:mAG-zGem(1/100)) aortas with nigericin stimulation (12–30 hpf) (DA, dorsal aorta; fold change calculated within each clutch). (G) Imaging of Flk1+EdU+ cells in the DA region in 36 hpf Tg(flk1:mCherry) embryos labeled with EdU antibody. Asterisks in inset signify positive cells in the aortic floor. (H) Quantification of Flk1+EdU+ cells in the aortic floor of embryos from (G). Error bars indicate SD. (I) The proportion of Mpx+ neutrophils, Mfap4+ macrophages, Rag2+ lymphocytes, and Gata1+ erythroblasts in transgenic embryos was assessed with prolonged Nigericin stimulation (24–120 hpf) by flow cytometry. Error bars indicate SD. ∗p < 0.05, ∗∗p < 0.01, ∗∗∗∗p < 0.0001. Scale bars, 100 μm. See also Figure S4. |
|
ZFIN is incorporating published figure images and captions as part of an ongoing project. Figures from some publications have not yet been curated, or are not available for display because of copyright restrictions. EXPRESSION / LABELING:
PHENOTYPE:
|
|
ZFIN is incorporating published figure images and captions as part of an ongoing project. Figures from some publications have not yet been curated, or are not available for display because of copyright restrictions. |
Reprinted from Developmental Cell, 55(2), Frame, J.M., Kubaczka, C., Long, T.L., Esain, V., Soto, R.A., Hachimi, M., Jing, R., Shwartz, A., Goessling, W., Daley, G.Q., North, T.E., Metabolic Regulation of Inflammasome Activity Controls Embryonic Hematopoietic Stem and Progenitor Cell Production, 133-149.e6, Copyright (2020) with permission from Elsevier. Full text @ Dev. Cell