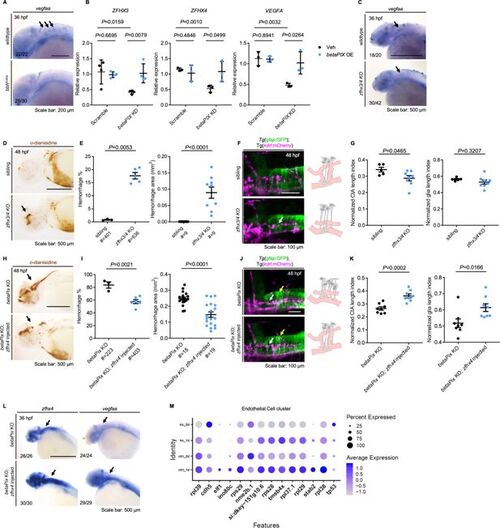
Zfhx3/4 acts downstream of betaPix to regulate vascular integrity development. (A) Whole-mount RNA in situ hybridization revealing that Vegfaa decreased in bbhfn40a mutants compared with siblings at 36 hpf. Lateral views with anterior to the left. Arrows indicate vegfaa expression in the CtAs that showed depletion in bbhfn40a mutants. (B) qRT-PCR analysis revealing that ZFHX3, ZFHX4, and VEGFA decreased in U251 cells transfected with betaPIX siRNA, which were rescued by betaPIX overexpression. Data are presented in mean ± SEM; one-way ANOVA with Dunnett’s test, individual p-values mentioned in the figure. (C) Whole-mount RNA in situ hybridization showing that vegfaa decreased in CRISPR-mediated zfhx3/4 F0 knockout embryos at 36 hpf. Lateral views with anterior to the left. Arrows indicate vegfaa expression in the CtAs that showed reduction in zfhx3/4 knockouts. (D) Representative stereomicroscopy images of erythrocytes stained with o-dianisidine in siblings and CRISPR-mediated zfhx3/4 F0 knockout embryos at 48 hpf. Arrows indicated brain hemorrhages in the knockout brains. Lateral views with anterior to the left. (E) Quantification of hemorrhagic parameters in (D). Left panel showing hemorrhage percentages, with independent experiment as dot. Right panel showing hemorrhage areas with each dot representing one embryo. # represents the numbers of embryos scored for each analysis, three or more individual experiments conducted. Data are presented in mean ± SEM; unpaired Student’s t-test with individual p-values mentioned in the figure. (F) Left panel showing 3D reconstruction of the glial structure (green) and vasculature (magenta) in the hindbrain of siblings and CRISPR-mediated zfhx3/4 F0 knockouts at 48 hpf. Lateral view with anterior to the left. White arrows indicate CtA defects. Right panels show schematic diagrams. Glia (gray) developed normally in both treatments, while defects in central artery (pink) presented in zfhx3/4 knockout embryos. (G) Quantification of CtA and glia length parameters of (F). Length index normalized to individual head length, with each dot representing one embryo. Data are presented in mean ± SEM; unpaired Student’s t-test with individual p-values mentioned in the figure. (H) Representative stereomicroscopy images of erythrocytes stained with o-dianisidine in CRISPR-mediated betaPix F0 knockout embryos with or without zfhx4 mRNA injection at 48 hpf. Arrows indicate brain hemorrhages. Lateral views with anterior to the left. (I) Quantification of hemorrhagic parameters in (H). Left panel showing hemorrhage percentages, with independent experiment as dot. Right panel showing hemorrhage areas with each dot representing one embryo. # represents the numbers of embryos scored for each analysis, three or more individual experiments conducted. Data are presented in mean ± SEM; unpaired Student’s t-test with individual p-values mentioned in the figure. (J) Left panel showing 3D reconstruction of the glial structure (green) and vasculature (magenta) in CRISPR-mediated betaPix F0 knockout embryos with or without zfhx4 mRNA injection at 48 hpf. White arrows indicate CtAs and yellow arrows indicate glia. Right panels show schematic diagrams. Glia (gray) and CtA (pink) developmental defects rescued in zfhx4 treatment. (K) Quantification of CtA and glia length parameters in (J). Length index normalized to individual head length, with each dot representing one embryo. Data are presented in mean ± SEM; unpaired Student’s t-test with individual p-values mentioned in the figure. (L) Whole-mount RNA in situ hybridization revealed that Zfhx4 and Vegfaa decreased in CRISPR-mediated betaPix F0 knockout embryos at 36 hpf, which were rescued by Zfhx4 mRNA injection. Lateral views with anterior to the left. Arrows indicate hindbrain regions. (M) Dot plots of several angiogenesis-associated genes expression in endothelial cell cluster. Dot size indicates the percentage of cells with gene expression, and dot color represents the average gene expression level. Individual scale bars are indicated in the figure.
|
