
Fig. 5 - Supplemental 1
- ID
- ZDB-FIG-260217-17
- Publication
- Chiu et al., 2026 - Glial betaPix is essential for blood vessel development in the zebrafish brain
- Other Figures
- All Figure Page
- Back to All Figure Page
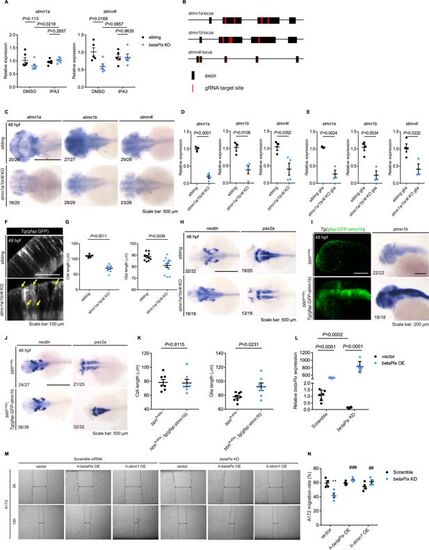
CRISPR-mediated stmn1a/1b/4 l F0 knockouts have similar but milder phenotypes as betaPix knockouts. (A) qRT-PCR analysis showing that IPA3 treatment rescued stmn1a and stmn4l expression in CRISPR-mediated betaPix F0 knockouts at 48 hpf. Each dot represents one embryo. Data are presented in mean ± SEM; one-way ANOVA with Dunnett’s test, individual p-values mentioned in the figure. (B) Schematic diagram illustrates four-guide RNAs-mediated F0 knockout strategy in the loci of stmn1a, stmn1b, and stmn4l. (C) Whole-mount RNA in situ hybridization confirming that stmn1a, stmn1b, and stmn4l decreased in CRISPR-mediated stmn1a/1b/4 l F0 knockouts at 48 hpf. Dorsal views with anterior to the left. (D) qRT-PCR analysis confirming that stmn1a, stmn1b, and stmn4l decreased in mutant embryos of CRISPR-mediated stmn1a/1b/4 l F0 knockouts at 48 hpf. Each dot represents one embryo. Data are presented in mean ± SEM; unpaired Student’s t-test with individual p-values mentioned in the figure. (E) qRT-PCR analysis confirming that stmn1a, stmn1b, and stmn4l decreased in the FACS-sorted glia of CRISPR-mediated stmn1a/1b/4 l F0 knockouts at 48 hpf. Each dot represents sorted cells from one embryo. Data are presented in mean ± SEM; unpaired Student’s t-test with individual p-values mentioned in the figure. (F) Optical sections of glial structure in the hindbrains of siblings and CRISPR-mediated stmn1a/1b/4 l F0 knockouts at 48 hpf. Lateral view with anterior to the left. Abnormal glial structures with disoriented arrangements (yellow arrows) in stmn1a/1b/4l mutant embryos. (G) Quantification of average CtA and glial length in Figure 5E. Each dot represents one embryo. Data are presented in mean ± SEM; unpaired Student’s t-test with individual p-values mentioned in the figure. (H) Whole-mount RNA in situ hybridization revealed that nestin increased while pax2a decreased in CRISPR-mediated stmn1a/1b/4 l F0 knockout embryos at 48 hpf. Dorsal views with anterior to the left. (I) 3D reconstruction and whole-mount RNA in situ hybridization showing that gfap:GFP-stmn1b transgenic overexpression rescued glial defects in bbhfn40a; Tg(gfap:GFP-stmn1b) embryos at 48 hpf. Lateral views with anterior to the left. (J) Whole-mount RNA in situ hybridization showing that nestin and pax2a were normally expressed in bbhfn40a; Tg(gfap:GFP-stmn1b) embryos at 48 hpf. Dorsal views with anterior to the left. (K) Quantification of average CtA and glia length in Figure 5I. Each dot represents one embryo. Data are presented in mean ± SEM; unpaired Student’s t-test with individual p-values mentioned in the figure. (L) qRT-PCR analysis confirming the efficacy of betaPix transgenic overexpression and betaPix siRNA knockdown in U251 cells. Data are presented in mean ± SEM; one-way ANOVA with Dunnett’s test, individual p-values mentioned in the figure. (M) Representative stereomicroscopy images of A172 cells at 0 and 18 hours after wounding. betaPIX siRNA treatment decreased A172 cell migration, which was rescued by either betaPIX or STMN1 overexpression. The wound edges are highlighted by dashed lines, with arrow lines indicating the wound width. (N) Quantification of wound closures in (M). Data are presented in mean ± SEM; one-way ANOVA with Dunnett’s test. **p<0.01 compared to negative control siRNA and empty vector transfection. ##p<0.01, ###P<0.005 compared to betaPix knockdown and empty vector transfection. Individual scale bars are indicated in the figure. |